MATLAB: An Introduction with Applications
6th Edition
ISBN: 9781119256830
Author: Amos Gilat
Publisher: John Wiley & Sons Inc
expand_more
expand_more
format_list_bulleted
Question
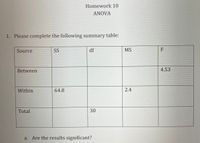
Complete the source table.

Transcribed Image Text:Homework 10
ANOVA
1. Please complete the following summary table:
Source
SS
df
MS
F
Between
4.53
Within
64.8
2.4
Total
30
a. Are the results significant?
Expert Solution
This question has been solved!
Explore an expertly crafted, step-by-step solution for a thorough understanding of key concepts.
This is a popular solution
Trending nowThis is a popular solution!
Step by stepSolved in 2 steps with 1 images

Knowledge Booster
Similar questions
- A. Find the ZSTAT B. What is the p-valuearrow_forwardA smartphone device has a certain cost. A person gets this smartpone and sign up for a monthly wireless plan with a fixed price plus a charge per GB of data used. Which one of these is the independent variable? a. The cost of the smartphone b. The base monthly price of the plan. c. The charge per GB of data use. d. the total amt they pay for the new device and the new phone plan in the first month.arrow_forward1arrow_forward
- What is the required workstation cycle time and efficiency of the line balance? Use the cycle time to to balance the line using the largest number of tasks found in the chart to be filled in. Leave no cells blank - be certain to enter "0" wherever required.arrow_forwardPart 3: Create a visual of your model- Use what you found in parts 1 and 2. Use smiley face stickers for the 30 people and the 100 gold star stickers for the wealth. Asia North America Europe North America South America Europe Africa Oceania Antarctica South America Africa Oceania 57 52arrow_forwardAlert for not submit AI generated answer. I need unique and correct answer. Don't try to copy from anywhere. Do not give answer in image formet and hand writingarrow_forward
- 4. Use this data from the HANES5 survey to estimate the average weight of men 18 and over whose heights were 73 inches. average height: 69 inches average weight: 190 pounds r = 0.41 SD 3 inches SD 42 poundsarrow_forwardThe basketball coach at a local college believes that his team scores more points at home games when more people show up. Below is a list of all home games last year with scores and corresponding attendance. Use Excel, SPSS, or work by hand to show your work finding r. Show your work on the attached pages. Score Attendance Score Attendance 54 380 67 410 57 350 78 215 59 320 67 113 80 478 56 250 82 451 85 450 75 250 101 489 73 489 99 472 53 451 What is the obtained t-score for this correlation? What is the critical t-score for a two-tailed test with a = 0.05? Is this correlation significant based on the t-scores?arrow_forwardThe top 6 companies and the amount each spent on advertising in billions of dollars are as follows: Company At&T Advertising ($ billions) 3.5 Verizon Procter & Gamble L'Oreal Comcast Ford 2.4 4.1 2.1 3.7 2.7 Find the interquartile range for advertising (in $ billions). O a. 2.000 O b. None of the answers is correct OC. 1.475 Od. 1.825 O e. 1.350arrow_forward
- Solvearrow_forward5. See pictures to solvearrow_forwardFIND THE ANSWERS FOR B-2 and C. A survey found that Massachusetts residents spent an average of $861.75 on the lottery, more than three times the U.S. average. A researcher at a Boston think tank believes that Massachusetts residents spend less than this amount. He surveys 100 Massachusetts residents and asks them about their annual expenditures on the lottery. (You may find it useful to reference the t table.) Click here for the Excel Data File a. Specify the competing hypotheses to test the researcher’s claim.multiple choice 1 H0: μ ≥ 861.75; HA: μ < 861.75 b-1. Calculate the value of the test statistic. (Negative value should be indicated by a minus sign. Round final answer to 3 decimal places.) -0.863 b-2. Find the p-value.multiple choice 2 p-value < 0.01 0.01 p-value < 0.025 0.025 p-value < 0.05 0.05 p-value < 0.10 p-value 0.10 c. At α = 0.10, what is the conclusion?multiple choice 3 Reject H0; there is insufficient evidence…arrow_forward
arrow_back_ios
SEE MORE QUESTIONS
arrow_forward_ios
Recommended textbooks for you
 MATLAB: An Introduction with ApplicationsStatisticsISBN:9781119256830Author:Amos GilatPublisher:John Wiley & Sons Inc
 Probability and Statistics for Engineering and th...StatisticsISBN:9781305251809Author:Jay L. DevorePublisher:Cengage Learning
 Statistics for The Behavioral Sciences (MindTap C...StatisticsISBN:9781305504912Author:Frederick J Gravetter, Larry B. WallnauPublisher:Cengage Learning
 Elementary Statistics: Picturing the World (7th E...StatisticsISBN:9780134683416Author:Ron Larson, Betsy FarberPublisher:PEARSON
 The Basic Practice of StatisticsStatisticsISBN:9781319042578Author:David S. Moore, William I. Notz, Michael A. FlignerPublisher:W. H. Freeman
 Introduction to the Practice of StatisticsStatisticsISBN:9781319013387Author:David S. Moore, George P. McCabe, Bruce A. CraigPublisher:W. H. Freeman

MATLAB: An Introduction with Applications
Statistics
ISBN:9781119256830
Author:Amos Gilat
Publisher:John Wiley & Sons Inc

Probability and Statistics for Engineering and th...
Statistics
ISBN:9781305251809
Author:Jay L. Devore
Publisher:Cengage Learning

Statistics for The Behavioral Sciences (MindTap C...
Statistics
ISBN:9781305504912
Author:Frederick J Gravetter, Larry B. Wallnau
Publisher:Cengage Learning

Elementary Statistics: Picturing the World (7th E...
Statistics
ISBN:9780134683416
Author:Ron Larson, Betsy Farber
Publisher:PEARSON

The Basic Practice of Statistics
Statistics
ISBN:9781319042578
Author:David S. Moore, William I. Notz, Michael A. Fligner
Publisher:W. H. Freeman

Introduction to the Practice of Statistics
Statistics
ISBN:9781319013387
Author:David S. Moore, George P. McCabe, Bruce A. Craig
Publisher:W. H. Freeman