MATLAB: An Introduction with Applications
6th Edition
ISBN: 9781119256830
Author: Amos Gilat
Publisher: John Wiley & Sons Inc
expand_more
expand_more
format_list_bulleted
Question
thumb_up100%
The first pic is the question. Since some tutors have been solving the problems wrong recently (no judgment), I’ve added a sample question to solve problem.

Transcribed Image Text:Sample Question
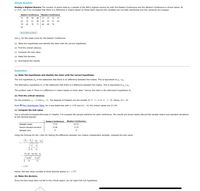
Hockey's Highest Scorers The number of points held by a sample of the NHL's highest scorers for both the Eastern Conference and the Western Conference is shown below. At
a = 0.01, can it be concluded that there is a difference in means based on these data? Assume the variables are normally distributed and the variances are unequal.
Eastern Conference Western Conference
77 37 72 57
75 78 70
88
62 59 61 98
66
55
61
64
59
62
70 71
66
68
76
82
Send data to Excel
Use u, for the mean score for the Eastern Conference.
(a) State the hypotheses and identify the claim with the correct hypothesis.
(b) Find the critical value(s).
(c) Compute the test value.
(d) Make the decision.
(e) Summarize the results.
Explanation
(a) State the hypotheses and identify the claim with the correct hypothesis.
The null hypothesis IH, is the statement that there is no difference between the means. This is equivalent to u, -H,.
The alternative hypothesis H is the statement that there is a difference between the means. This is equivalent to u, #µ,.
The problem asks if "there is a difference in means based on these data." Hence, the claim is the alternative hypothesis H,.
(b) Find the critical value(s).
For this problem, n, = 13 and n, = 11. The degrees of freedom are the smaller of 13 –1= 12 or 11-1= 10. Hence, d.f. = 10.
From OThe t Distribution Table, for a two-tailed test with a = 0.01 and d.f. = 10, the critical values are 13.169.
(c) Compute the test value.
Use a calculator/computer/formulas in Chapter 3 to compute the sample statistics for each conference. The results are shown below (Round the sample means and standard deviations
to two decimal places):
Eastern Conference Western Conference
Sample mean
71.92
63.55
Sample standard deviation
12.06
11.25
Sample size
13
11
Using the formula for the i test-for testing the difference between two means-independent samples, compute the test value:
(X, - X2)- (H, – 4-)
2.
-+-
(71.92 – 63.55)-0
12.06 11.25?
13
11
= 1.757
Hence, the test value rounded to three decimal places is t= 1.757.
(d) Make the decision.
Since the test value does not fall in the critical region, do not reject the null hypothesis.

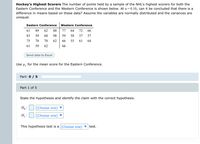
Transcribed Image Text:Hockey's Highest Scorers The number of points held by a sample of the NHL's highest scorers for both the
Eastern Conference and the Western Conference is shown below. At a=0.10, can it be concluded that there is a
difference in means based on these data? Assume the variables are normally distributed and the variances are
unequal.
Eastern Conference
Western Conference
61
89
62
88
77
64
72
66
83
59
60
98
59
58
37
57
75
78
70
62
66
55
61
64
61
59
62
66
Send data to Excel
Use u, for the mean score for the Eastern Conference.
Part: 0 / 5
Part 1 of 5
State the hypotheses and identify the claim with the correct hypothesis.
Ho :
|(Choose one) ▼
H :
(Choose one)
This hypothesis test is a(Choose one) ▼
test.
Expert Solution
This question has been solved!
Explore an expertly crafted, step-by-step solution for a thorough understanding of key concepts.
This is a popular solution
Trending nowThis is a popular solution!
Step by stepSolved in 3 steps with 3 images

Knowledge Booster
Similar questions
- what are some tips to study for the FSA test like the reading and math as well.arrow_forwardSolve number 5 and explainarrow_forwardThomas scored at the 45th percentile on the midterm. Which interpretation of his score is the best? Group of answer choices 45% of the people tested exceeded his score. Thomas had a better score than 45% of the people tested. Thomas got 45% of the items correct. More than one of the above is appropriate.arrow_forward
- For this problem, assume the test had 6 true-false questions and 8 multiple-choice questions, and that each multiple-choice question had 5 choices. How many different answer sheets can be submitted?arrow_forwardExplain about Other Multiple Comparison Tests.arrow_forwardWhen taking a 20 question multiple choice test, where each question has 3 possible answers, it would be unusual to get or more questions correct by guessing alone. Give your answer in the box above as a whole number.arrow_forward
arrow_back_ios
arrow_forward_ios
Recommended textbooks for you
 MATLAB: An Introduction with ApplicationsStatisticsISBN:9781119256830Author:Amos GilatPublisher:John Wiley & Sons Inc
 Probability and Statistics for Engineering and th...StatisticsISBN:9781305251809Author:Jay L. DevorePublisher:Cengage Learning
 Statistics for The Behavioral Sciences (MindTap C...StatisticsISBN:9781305504912Author:Frederick J Gravetter, Larry B. WallnauPublisher:Cengage Learning
 Elementary Statistics: Picturing the World (7th E...StatisticsISBN:9780134683416Author:Ron Larson, Betsy FarberPublisher:PEARSON
 The Basic Practice of StatisticsStatisticsISBN:9781319042578Author:David S. Moore, William I. Notz, Michael A. FlignerPublisher:W. H. Freeman
 Introduction to the Practice of StatisticsStatisticsISBN:9781319013387Author:David S. Moore, George P. McCabe, Bruce A. CraigPublisher:W. H. Freeman

MATLAB: An Introduction with Applications
Statistics
ISBN:9781119256830
Author:Amos Gilat
Publisher:John Wiley & Sons Inc

Probability and Statistics for Engineering and th...
Statistics
ISBN:9781305251809
Author:Jay L. Devore
Publisher:Cengage Learning

Statistics for The Behavioral Sciences (MindTap C...
Statistics
ISBN:9781305504912
Author:Frederick J Gravetter, Larry B. Wallnau
Publisher:Cengage Learning

Elementary Statistics: Picturing the World (7th E...
Statistics
ISBN:9780134683416
Author:Ron Larson, Betsy Farber
Publisher:PEARSON

The Basic Practice of Statistics
Statistics
ISBN:9781319042578
Author:David S. Moore, William I. Notz, Michael A. Fligner
Publisher:W. H. Freeman

Introduction to the Practice of Statistics
Statistics
ISBN:9781319013387
Author:David S. Moore, George P. McCabe, Bruce A. Craig
Publisher:W. H. Freeman