
MATLAB: An Introduction with Applications
6th Edition
ISBN: 9781119256830
Author: Amos Gilat
Publisher: John Wiley & Sons Inc
expand_more
expand_more
format_list_bulleted
Related questions
Question
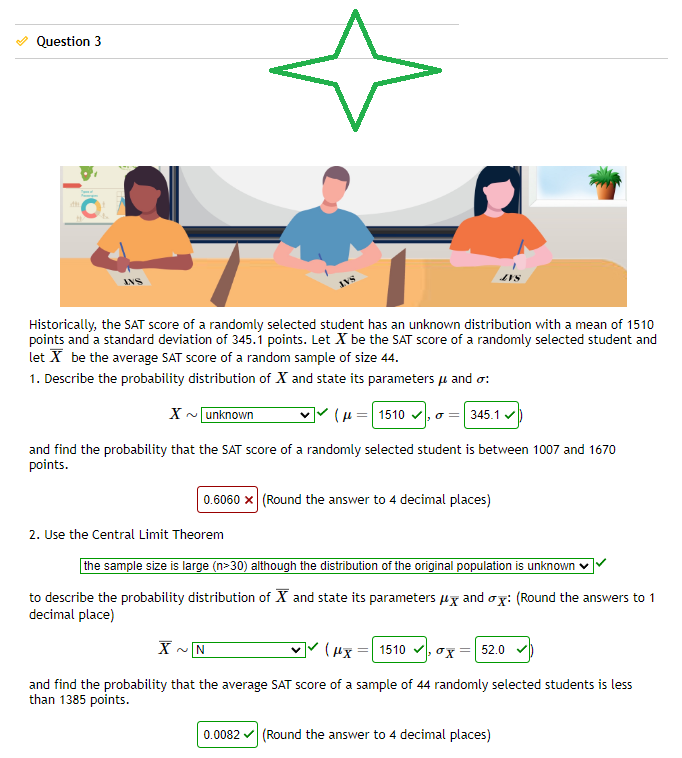

Transcribed Image Text:Question 3
Historically, the SAT score of a randomly selected student has an unknown distribution with a mean of 1510
points and a standard deviation of 345.1 points. Let X be the SAT score of a randomly selected student and
let X be the average SAT score of a random sample of size 44.
1. Describe the probability distribution of X and state its parameters μ and o:
X~ unknown
(μ=1510,0 = 345.1
and find the probability that the SAT score of a randomly selected student is between 1007 and 1670
points.
0.6060 x (Round the answer to 4 decimal places)
2. Use the Central Limit Theorem
the sample size is large (n>30) although the distribution of the original population is unknown
to describe the probability distribution of X and state its parameters μ and ox: (Round the answers to 1
decimal place)
X~N
(μχ 1510 x
and find the probability that the average SAT score of a sample of 44 randomly selected students is less
than 1385 points.
52.0
0.0082✓ (Round the answer to 4 decimal places)
Expert Solution
This question has been solved!
Explore an expertly crafted, step-by-step solution for a thorough understanding of key concepts.

This is a popular solution

Trending nowThis is a popular solution!

Step by stepSolved in 3 steps with 3 images

Knowledge Booster

Similar questions
- Use the central limit theorem to find the mean and standard error of the mean of the indicated sampling distribution. Then sketch a graph of the sampling distribution. The per capita consumption of red meat by people in a country in a recent year was normally distributed, with a mean of 106 pounds and a standard deviation of 38.6 pounds. Random samples of size 17 are drawn from this population and the mean of each sample is determined. Ux = Standard deviation =arrow_forwardThe average number of mosquitos in a stagnant pond is 80 per square meter with a standard deviation of 16 17 16 square meters are chosen at random for a mosquito count, find the probability that the average of those counts is more than 82.8 mosquitos per square meter. Assume that the variable is normally distributed.arrow_forwardAssume that adults have IQ scores that are normally distributed with a mean of μ=100and a standard deviation σ=20. Find the probability that a randomly selected adult has an IQ less than 128.arrow_forward
- Assume that adults have IQ scores that are normally distributed with a mean of μ=100 and a standard deviation σ=20. Find the probability that a randomly selected adult has an IQ less than 124 The probability that a randomly selected adult has an IQ less than 124 is (Type an integer or decimal rounded to four decimal places as needed.)arrow_forwardAssume that the readings at freezing on a bundle of thermometers are normally distributed with a mean of 0°C and a standard deviation of 1.00°C. A single thermometer is randomly selected and tested. Find the probability of obtaining a reading less than -2.506°C.arrow_forwardAssume that adults have IQ scores that are normally distributed with a mean of mu equals 100μ=100 and a standard deviation sigma equals 20σ=20. Find the probability that a randomly selected adult has an IQ between 84 and 116.arrow_forward
- The percent of fat calories that a person in America consumes each day is normally distributed with a mean of about 36 and a standard deviation of 10. Suppose that one individual is randomly chosen. Let X = percent of fat calories. (a) Find the z-score corresponding to 40 percent of fat calories, rounded to 3 decimal places. (b) Find the probability that the percent of fat calories a person consumes is more than 40. (c) Shade the area corresponding to this probability in the graph below. (Hint: The x-axis is the z- score. Use your z-score from part (a), rounded to one decimal place). Shade: Left of a value Click and drag the arrows to adjust the values. -3 -2 -1 2 3 4 -1.5 (d) Find the maximum number for the lower quarter of percent of fat calories. Round your answer to 3 decimal places.arrow_forwardAssume that females have pulse rates that are normally distributed with a mean of μ=73.0 beats per minute and a standard deviation of σ=12.5 beats per minute If 16 adult females are randomly selected, find the probability that they have pulse rates with a mean less than 76 beats per minute.arrow_forwardAssume that adults have IQ scores that are normally distributed with mean of mu = 100 and a standard deviation sigma=20, Find the probability that a randomly selected adult has an IQ 80 and 120 the probability that a randomly selected adult has an IQ between 80 and 120 is (type an integer or decimal rounfed to four decimal places as needed)arrow_forward
- Assume that females have pulse rates that are normally distributed with a mean of mu equals 74.0 beats per minute and a standard deviation of sigma equals 12.5 beats per minute. If 16 adult females are randomly selected, find the probability that they have pulse rates with a mean between 68 beats per minute and 80 beats per minute.arrow_forwardAssume that adults have IQ scores that are normally distributed with a mean of mμ=100 and a standard deviation σ= 15. Find the probability that a randomly selected adult has an IQ less than 127. The probability that a randomly selected adult has an IQ less tha 127 isarrow_forwardAssume that the amount of weight that male college students gain during their freshman year are normally distributed with a. Mean of u= 1.2 kg and a standard deviation of o= 5.1 kg A. If 1 male college student is randomly selected, Find the probability that he gains between 0 and 3 kg during freshman year B. If 25 male college students are randomly selected find the probability that their mean weight gain during freshman year is between 0 and 3 kg why can the normal distribution be used on pet b even though the sample size does not exceed 30?arrow_forward
arrow_back_ios
SEE MORE QUESTIONS
arrow_forward_ios
Recommended textbooks for you
- MATLAB: An Introduction with ApplicationsStatisticsISBN:9781119256830Author:Amos GilatPublisher:John Wiley & Sons Inc
 Probability and Statistics for Engineering and th...StatisticsISBN:9781305251809Author:Jay L. DevorePublisher:Cengage Learning
 Statistics for The Behavioral Sciences (MindTap C...StatisticsISBN:9781305504912Author:Frederick J Gravetter, Larry B. WallnauPublisher:Cengage Learning
  Elementary Statistics: Picturing the World (7th E...StatisticsISBN:9780134683416Author:Ron Larson, Betsy FarberPublisher:PEARSON
 The Basic Practice of StatisticsStatisticsISBN:9781319042578Author:David S. Moore, William I. Notz, Michael A. FlignerPublisher:W. H. Freeman
 Introduction to the Practice of StatisticsStatisticsISBN:9781319013387Author:David S. Moore, George P. McCabe, Bruce A. CraigPublisher:W. H. Freeman
MATLAB: An Introduction with Applications
Statistics
ISBN:9781119256830
Author:Amos Gilat
Publisher:John Wiley & Sons Inc
Probability and Statistics for Engineering and th...
Statistics
ISBN:9781305251809
Author:Jay L. Devore
Publisher:Cengage Learning
Statistics for The Behavioral Sciences (MindTap C...
Statistics
ISBN:9781305504912
Author:Frederick J Gravetter, Larry B. Wallnau
Publisher:Cengage Learning
Elementary Statistics: Picturing the World (7th E...
Statistics
ISBN:9780134683416
Author:Ron Larson, Betsy Farber
Publisher:PEARSON
The Basic Practice of Statistics
Statistics
ISBN:9781319042578
Author:David S. Moore, William I. Notz, Michael A. Fligner
Publisher:W. H. Freeman
Introduction to the Practice of Statistics
Statistics
ISBN:9781319013387
Author:David S. Moore, George P. McCabe, Bruce A. Craig
Publisher:W. H. Freeman