MATLAB: An Introduction with Applications
6th Edition
ISBN: 9781119256830
Author: Amos Gilat
Publisher: John Wiley & Sons Inc
expand_more
expand_more
format_list_bulleted
Concept explainers
Topic Video
Question
For the last two Check all that apply

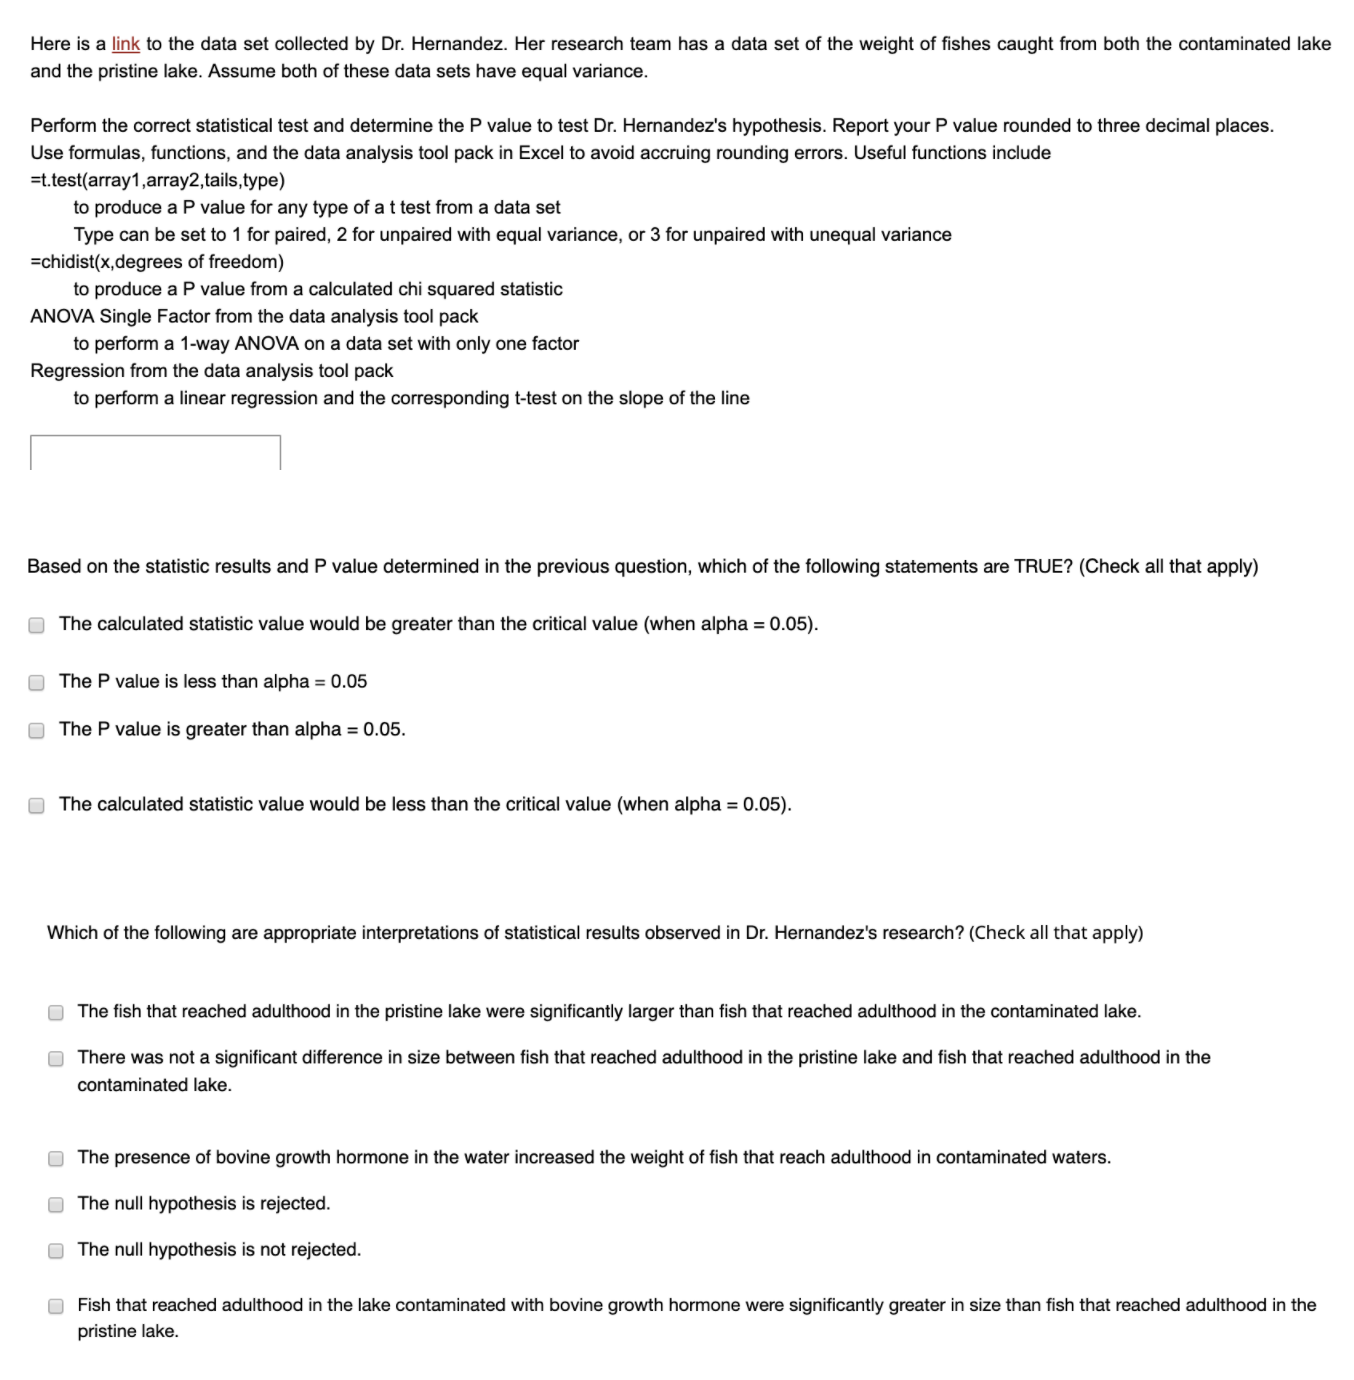
Transcribed Image Text:Here is a link to the data set collected by Dr. Hernandez. Her research team has a data set of the weight of fishes caught from both the contaminated lake
and the pristine lake. Assume both of these data sets have equal variance.
Perform the correct statistical test and determine the P value to test Dr. Hernandez's hypothesis. Report your P value rounded to three decimal places.
Use formulas, functions, and the data analysis tool pack in Excel to avoid accruing rounding errors. Useful functions include
=t.test(array1,array2,tails,type)
to produce a P value for any type of a t test from a data set
Type can be set to 1 for paired, 2 for unpaired with equal variance, or 3 for unpaired with unequal variance
=chidist(x,degrees of freedom)
to produce a P value from a calculated chi squared statistic
ANOVA Single Factor from the data analysis tool pack
to perform a 1-way ANOVA on a data set with only one factor
Regression from the data analysis tool pack
to perform a linear regression and the corresponding t-test on the slope of the line
Based on the statistic results and P value determined in the previous question, which of the following statements are TRUE? (Check all that apply)
O The calculated statistic value would be greater than the critical value (when alpha = 0.05).
O The P value is less than alpha = 0.05
O The P value is greater than alpha = 0.05.
O The calculated statistic value would be less than the critical value (when alpha = 0.05).
Which of the following are appropriate interpretations of statistical results observed in Dr. Hernandez's research? (Check all that apply)
O The fish that reached adulthood in the pristine lake were significantly larger than fish that reached adulthood in the contaminated lake.
O There was not a significant difference in size between fish that reached adulthood in the pristine lake and fish that reached adulthood in the
contaminated lake.
O The presence of bovine growth hormone in the water increased the weight of fish that reach adulthood in contaminated waters.
O The null hypothesis is rejected.
O The null hypothesis is not rejected.
O Fish that reached adulthood in the lake contaminated with bovine growth hormone were significantly greater in size than fish that reached adulthood in the
pristine lake.

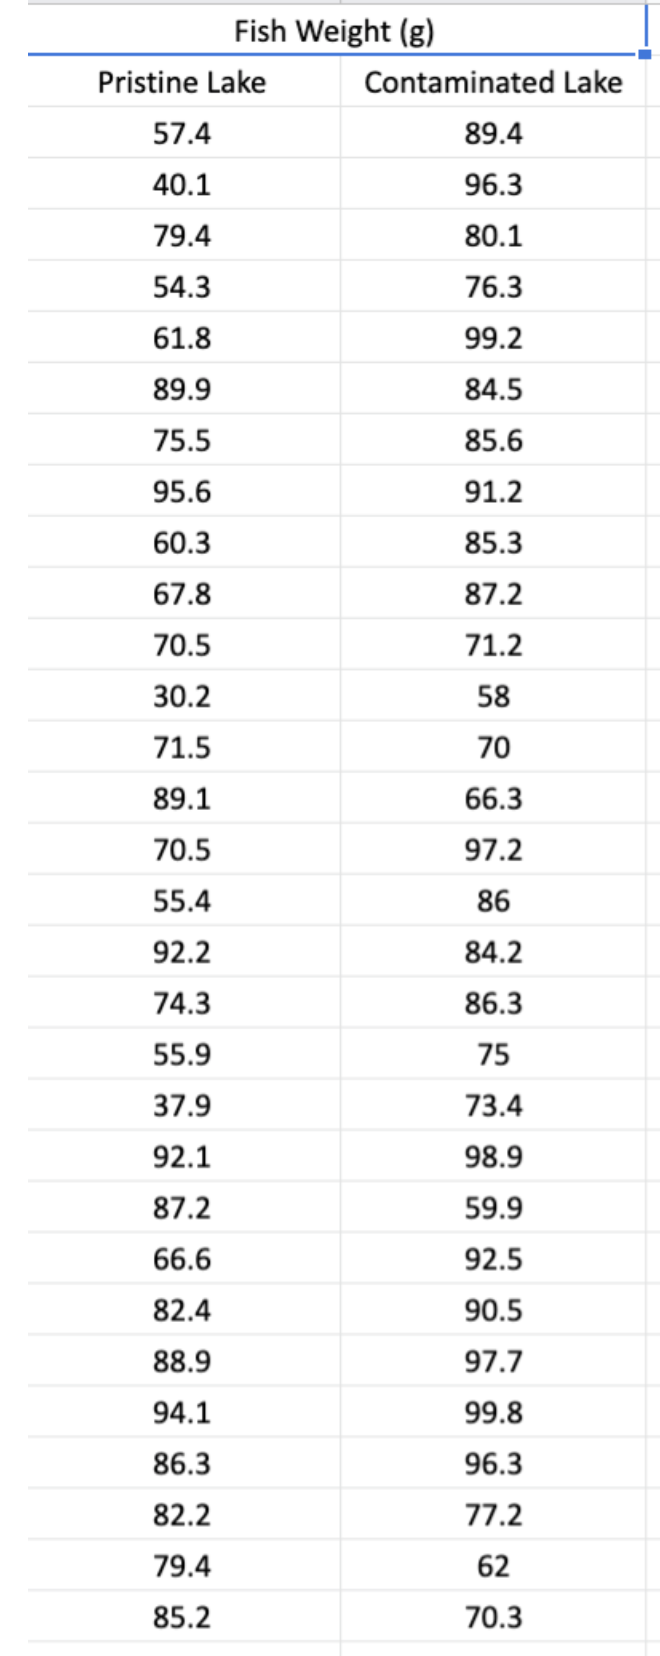
Transcribed Image Text:Fish Weight (g)
Pristine Lake
Contaminated Lake
57.4
89.4
40.1
96.3
79.4
80.1
54.3
76.3
61.8
99.2
89.9
84.5
75.5
85.6
95.6
91.2
60.3
85.3
67.8
87.2
70.5
71.2
30.2
58
71.5
70
89.1
66.3
70.5
97.2
55.4
86
92.2
84.2
74.3
86.3
55.9
75
37.9
73.4
92.1
98.9
87.2
59.9
66.6
92.5
82.4
90.5
88.9
97.7
94.1
99.8
86.3
96.3
82.2
77.2
79.4
62
85.2
70.3
Expert Solution
This question has been solved!
Explore an expertly crafted, step-by-step solution for a thorough understanding of key concepts.
This is a popular solution
Trending nowThis is a popular solution!
Step by stepSolved in 3 steps with 3 images

Knowledge Booster
Learn more about
Need a deep-dive on the concept behind this application? Look no further. Learn more about this topic, statistics and related others by exploring similar questions and additional content below.Similar questions
Recommended textbooks for you
 MATLAB: An Introduction with ApplicationsStatisticsISBN:9781119256830Author:Amos GilatPublisher:John Wiley & Sons Inc
 Probability and Statistics for Engineering and th...StatisticsISBN:9781305251809Author:Jay L. DevorePublisher:Cengage Learning
 Statistics for The Behavioral Sciences (MindTap C...StatisticsISBN:9781305504912Author:Frederick J Gravetter, Larry B. WallnauPublisher:Cengage Learning
 Elementary Statistics: Picturing the World (7th E...StatisticsISBN:9780134683416Author:Ron Larson, Betsy FarberPublisher:PEARSON
 The Basic Practice of StatisticsStatisticsISBN:9781319042578Author:David S. Moore, William I. Notz, Michael A. FlignerPublisher:W. H. Freeman
 Introduction to the Practice of StatisticsStatisticsISBN:9781319013387Author:David S. Moore, George P. McCabe, Bruce A. CraigPublisher:W. H. Freeman

MATLAB: An Introduction with Applications
Statistics
ISBN:9781119256830
Author:Amos Gilat
Publisher:John Wiley & Sons Inc

Probability and Statistics for Engineering and th...
Statistics
ISBN:9781305251809
Author:Jay L. Devore
Publisher:Cengage Learning

Statistics for The Behavioral Sciences (MindTap C...
Statistics
ISBN:9781305504912
Author:Frederick J Gravetter, Larry B. Wallnau
Publisher:Cengage Learning

Elementary Statistics: Picturing the World (7th E...
Statistics
ISBN:9780134683416
Author:Ron Larson, Betsy Farber
Publisher:PEARSON

The Basic Practice of Statistics
Statistics
ISBN:9781319042578
Author:David S. Moore, William I. Notz, Michael A. Fligner
Publisher:W. H. Freeman

Introduction to the Practice of Statistics
Statistics
ISBN:9781319013387
Author:David S. Moore, George P. McCabe, Bruce A. Craig
Publisher:W. H. Freeman