
MATLAB: An Introduction with Applications
6th Edition
ISBN: 9781119256830
Author: Amos Gilat
Publisher: John Wiley & Sons Inc
expand_more
expand_more
format_list_bulleted
Related questions
Question
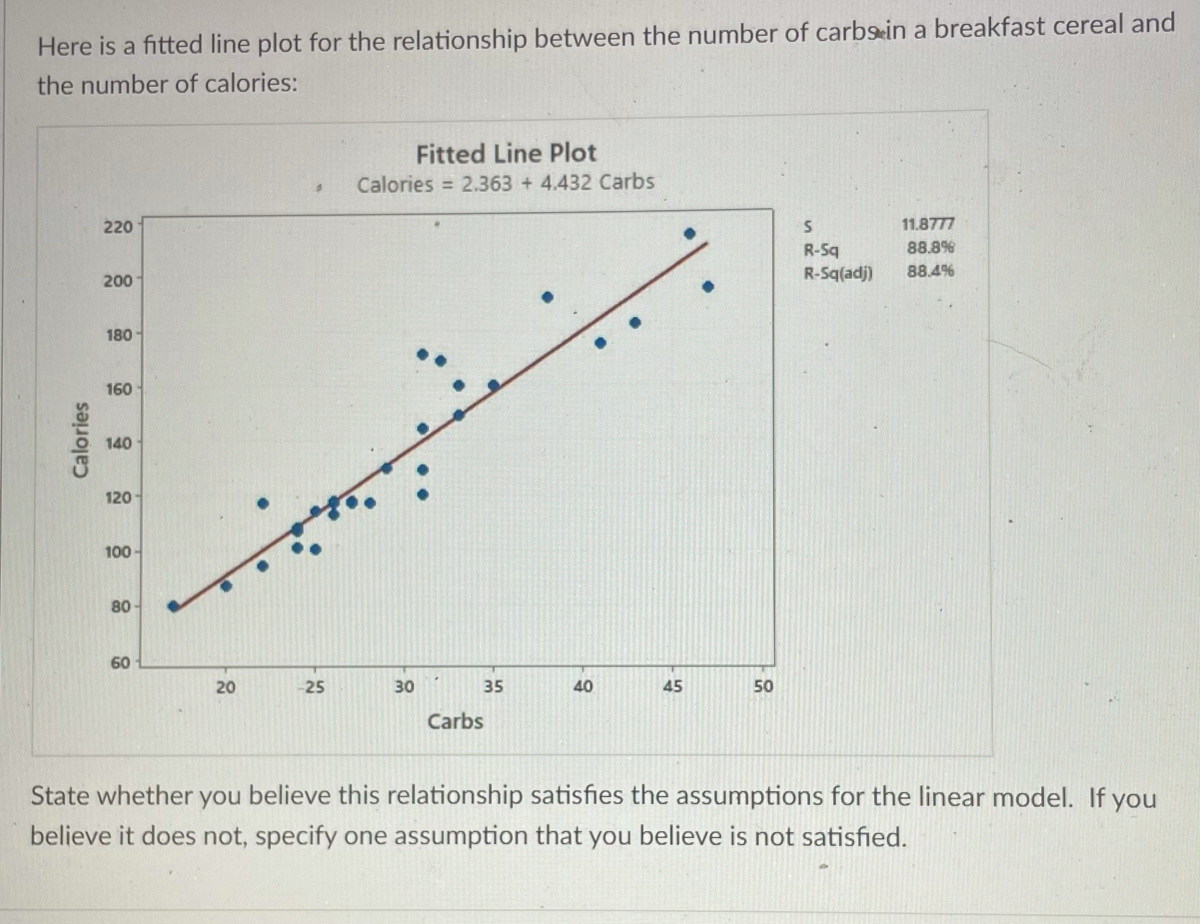

Transcribed Image Text:Here is a fitted line plot for the relationship between the number of carbsin a breakfast cereal and
the number of calories:
Fitted Line Plot
Calories = 2.363 + 4.432 Carbs
220
11.8777
88.8%
R-Sq
R-Sq(adj)
88.4%
200
180
160
140
120
100 -
80
60
20
25
30
35
40
45
50
Carbs
State whether
you
believe this relationship satisfies the assumptions for the linear model. If you
believe it does not, specify one assumption that you believe is not satisfied.
Calories
Expert Solution
This question has been solved!
Explore an expertly crafted, step-by-step solution for a thorough understanding of key concepts.

Step by stepSolved in 2 steps

Knowledge Booster

Similar questions
- Construct a normal quantile-quantile plot of the values provided in the accompanying data set, which represent the diameters of 36 rivet heads in 1/100 of an inch. Click the icon to view the diameter data. Choose the correct graph below. A. Normal Quantile-Quantile Plot Normal Quantile-Quantile Plot 5.95- 5.85- 5.75- 5.65- 0.2 0.4 0.6 0.8 1 5.65 5.75 5.85 5.95 Theoretical Quantities Theoretical Quantities D. Normal Quantile-Quantile Plot Normal Quantile-Quantile Plot 5.95- 1- 5.85- 0.5- 5.75- • 000 0- 5.65- -2 5.95 -1 1 5.65 5.75 5.85 Theoretical Quantities Theoretical Quantities Diameter data 5.83 5.77 5.81 5.73 5.73 5.75 5.85 5.84 5.83 5.89 5.71 5.83 5.71 5.81 5.87 5.81 5.84 5.74 5.83 5.84 5.78 5.76 5.71 5.87 5.82 5.78 5.75 5.82 5.89 5.79 Help me solve this View an example Get m 5.71 5.85 5.85 5.78 5.76 5.71 C. Sample Quantities Sample Quantities B. Sample Quantities Sample Quantities ofarrow_forwardUse the box-and-whisker plot to identify the five-number summary. Min = Q₁ = Q₂: = = Max = 936 1286 900 1200 1503 1500 1800 2086 1985 2100 Qarrow_forwardBased on the box plot, what are the range and ther interquartile range?arrow_forward
- Brand A vitamins 505 506 502 S04 503 S01 S00 497 198 amount of Vitamin C in each pill was measured and plotted. From this dot plot, find the median, quartiles, and interquartile range: 494 196 495 40 samples of Vitamin C pills were 493 492 Milligrams of vitamin C taken from bottles of Brand A and the Quartile 1: Median: Quartile 3: Interquartile Range: 507 0odso 00od 000od 00odarrow_forwardUsing the following stem & leaf plot, find the five number summary for the data. 0 2 3 4 4 5 9 3 4 2 2 79 0 45 6 89 6 0 8 Min = Q1 Med = Q3 = %3D Max =arrow_forwardThe following data are the maximum temperatures (in degrees Fahrenheit) of 17 cities in the United states measured on the same day. 53 70 65 74 85 76 84 70 61 59 54 66 56 71 81 73 76 Construct a box and whisker plot for the data.arrow_forward
- Please indicate whether the above scatter plot indicates an r value that is: a. close to r=-1 b. close to r=+1 с. clearly negative but not near r = -1 d. clearly positive but not near r = +1arrow_forwardThe dot plot shows the grades received on a recent test. : 十 70 75 80 85 90 95 100 Question 1: What is the range of the data? Question 2: What is the median of the data? the mode of the data? Question 3: What is Question 4: What is the mean of the data?arrow_forwardpts. See Details for more. > Next question 2 Try a similar question A and B are independent events. Use the following probabilities to answer the question. Round to 4 decimal places. P(A) = 0.47, P(A and B) = 0.23, find P(B) P(B) = 2.4454arrow_forward
- Using the following stem & leaf plot, find the five number summary for the data. View in full window so that you have 6 rows of data. 1 02 2 m 34459 4 2279 5 0 4 5 6 8 9 6 08 Min = Q₁² Med = Q3 Max = ▬▬▬▬arrow_forwardWrite the level of measurement (nominal, interval, ordinal, ratio) and type of data for each of the following: Level of Measurement Type of data: Qualitative Quantitative Discrete Quantitative Continuous Temperature (in degrees Fahrenheit) Jersey numbers of soccer players The weight of a chemical compound used in an experiment that is obtained using a well-adjusted scale An identification of police officers by rank College entrance exam scores, such as SAT scoresarrow_forwardBigger snakes weigh more. Here is data comparing the length in centimeters to weight in grams of a certain species of snake. Use your Ti-84 to create a scatter plot, then match your graph to the correct scatter plot. Length 80 32 61 19 25 45 46 76 Weight 211 65 75 20 80 125 65 150arrow_forward
arrow_back_ios
arrow_forward_ios
Recommended textbooks for you
- MATLAB: An Introduction with ApplicationsStatisticsISBN:9781119256830Author:Amos GilatPublisher:John Wiley & Sons Inc
 Probability and Statistics for Engineering and th...StatisticsISBN:9781305251809Author:Jay L. DevorePublisher:Cengage Learning
 Statistics for The Behavioral Sciences (MindTap C...StatisticsISBN:9781305504912Author:Frederick J Gravetter, Larry B. WallnauPublisher:Cengage Learning
  Elementary Statistics: Picturing the World (7th E...StatisticsISBN:9780134683416Author:Ron Larson, Betsy FarberPublisher:PEARSON
 The Basic Practice of StatisticsStatisticsISBN:9781319042578Author:David S. Moore, William I. Notz, Michael A. FlignerPublisher:W. H. Freeman
 Introduction to the Practice of StatisticsStatisticsISBN:9781319013387Author:David S. Moore, George P. McCabe, Bruce A. CraigPublisher:W. H. Freeman
MATLAB: An Introduction with Applications
Statistics
ISBN:9781119256830
Author:Amos Gilat
Publisher:John Wiley & Sons Inc
Probability and Statistics for Engineering and th...
Statistics
ISBN:9781305251809
Author:Jay L. Devore
Publisher:Cengage Learning
Statistics for The Behavioral Sciences (MindTap C...
Statistics
ISBN:9781305504912
Author:Frederick J Gravetter, Larry B. Wallnau
Publisher:Cengage Learning
Elementary Statistics: Picturing the World (7th E...
Statistics
ISBN:9780134683416
Author:Ron Larson, Betsy Farber
Publisher:PEARSON
The Basic Practice of Statistics
Statistics
ISBN:9781319042578
Author:David S. Moore, William I. Notz, Michael A. Fligner
Publisher:W. H. Freeman
Introduction to the Practice of Statistics
Statistics
ISBN:9781319013387
Author:David S. Moore, George P. McCabe, Bruce A. Craig
Publisher:W. H. Freeman