
MATLAB: An Introduction with Applications
6th Edition
ISBN: 9781119256830
Author: Amos Gilat
Publisher: John Wiley & Sons Inc
expand_more
expand_more
format_list_bulleted
Related questions
Question
Here are summary statistics of the four last digits of social security number of 500 customers, corresponding to the following histogram.
Is the
choose the best answer for the question above:
a. Neither, because these are not quantitative data.
b. Median, because of the outliers.
c. Mean, because the distribution is quite symmetric.
D. Median, because the IQR is smaller than the standard deviation.
e. Neither, because these are not categorical data.
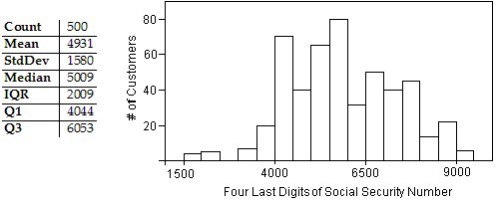

Transcribed Image Text:80-
Count
500
Mean
4931
60-
StdDev
1580
Median
IQR
Q1
Q3
5009
2009
4044
6053
40-
20-
1500
4000
6500
9000
Four Last Digits of Social Security Number
#of Customers
Expert Solution
arrow_forward
Step 1
Given,
Here are summary statistics of the four last digits of social security number of 500 customers, corresponding to the following histogram.
Is the mean or median a "better" summary of the center of the distribution?

Trending nowThis is a popular solution!

Step by stepSolved in 2 steps

Knowledge Booster

Similar questions
- last.arrow_forwardAn instructor plots the grade distribution for a practice final exam and determines that the grades were negatively skewed. Based on this what would be your recommendation A. The entire class should have to attend additional practice tutoring sessions in order to bring up the average. B. Not enough information to make a recomendation, would need to know the average grade (mean). C. The mean was larger than the mode. D. The majority of the class did well on the exam.arrow_forwardThe figure shows population density (people per square mile) for all states of a certain country. The states are divided into four geographical regions: A, B, C, and D. Answer the questions below. 100 200 300 400 500 600 700 800 900 10001100 People per Square Mile ㅇ Why is it best to compare medians and interquartile ranges for these data, rather than comparing means and standard deviations? A. Some of these data have outliers and/or are skewed, and the median and interquartile range amplify the effects of outliers and skewness. B. These data are fairly symmetric and do not have outliers, and the median and interquartile range provide more reliable information in these circumstances. C. Some of these data have vastly different centers, and the median and interquartile range provide more reliable information in these circumstances. D. Some of these data have outliers and/or are skewed, and the median and interquartile range are resistant to outliers. List the approximate median number…arrow_forward
- A dataset contains the categorical variable Gender as well as the quantitative variable Computer Games for the number of hours spent playing computer games per week. Use the side-by-side graph in the figure below showing the distribution of hours spent playing computer games for boys and girls to answer the following questions. Estimate the median time for girls playing games. Do we expect the mean time for girls to be greater than, smaller than, or about the same as the median? Do we expect the mean time for boys to be greater than, smaller than, or about the same as the median? Who spends more time playing computer games? 1 Farrow_forwardPlease write legible and clearlyarrow_forwardFind the mean, median, and mode of the following data. If necessary, round to one more decimal place than the largest number of decimal places given in the data. Rate of Fatal Alcohol Impaired Car Crashes per 100 Million Vehicle Miles of Travel 0.32 0.37 0.41 0.31 0.75 0.46 0.30 0.78 0.61 0.31 0.49 0.57 0.29 0.60 0.70 0.56 0.68 0.54 0.78 0.71 Mean: Median: Mode: or No Modearrow_forward
- Find the (a) mean, (b) median, (c) mode, and (d) midrange for the data and then (e) answer the given questions. Listed below are selling prices (dollars) of TVs that are 60 inches or larger and rated as a "best buy" by a popular magazine. Are the resulting statistics representative of the population of all TVs that are 60 inches and larger? If you decide to buy one of these TVs, what statistic is most relevant, other than the measures of central tendency? 1850 1000 1600 1000 1300 1150 1000 1100 1150 1350 1000 1450 a. Find the mean. The mean is $ (Type an integer or a decimal rounded to one decimal place as needed.)arrow_forwardGardena High School had a mean ACT score of 23, with a median score of 21 and a mode of 20. What kind of skewness would you expect their distribution curve to display? a. Symmetrical b. Right-skewed c. Left-skewed d. Not enough informationarrow_forwarda. In your own words, describe to someone who knows only a little statistics how to recognize when an observation is an outlier. What action(s) should be taken with an outlier? b. Which measure of the center (mean or median) is more resistant to outliers, and what does "resistant to outliers" mean?arrow_forward
- What analysis should I use to test the following correlation between the following variables: 1. Illinois Rape Myth Acceptance score 2. Gender of participant (male or female)arrow_forwardFind the (a) mean, (b) median, (c) mode, and (d) midrange for the data and then (e) answer the given questions. Listed below are the highest amounts of net worth (in millions of dollars) of all celebrities. What do the results tell us about the population of all celebrities? Based on the nature of the amounts, what can be inferred about their precision? 275 200 195 180 175 175 170 170 170 170arrow_forwardThe following are the prices (in dollars) of the six all-terrain truck tires rated most highly by a magazine in 2018. 158.00 195.00 154.00 127.65 121.99 126.00 USE SALT (a) Calculate the value of the mean. (Round your answers to the nearest cent.) $ Calculate the value of the median. (Round your answers to the nearest cent.) $ (b) Why are these values so different? O There are only 6 values. O The distribution of this set is positively skewed. O The distribution of this set is approximately normal. O The distribution of this set is negatively skewed. (c) Which of the two-mean or median-appears to be better as a description of a typical value for this data set? (Hint: See Example 4.5.) O The median is better since it is not influenced by the extreme value. The median is always better as a description of a typical value. The mean is better since it is not influenced by the extreme value. O The mean is always better as a description of a typical value. O The mean is as good a description…arrow_forward
arrow_back_ios
SEE MORE QUESTIONS
arrow_forward_ios
Recommended textbooks for you
- MATLAB: An Introduction with ApplicationsStatisticsISBN:9781119256830Author:Amos GilatPublisher:John Wiley & Sons Inc
 Probability and Statistics for Engineering and th...StatisticsISBN:9781305251809Author:Jay L. DevorePublisher:Cengage Learning
 Statistics for The Behavioral Sciences (MindTap C...StatisticsISBN:9781305504912Author:Frederick J Gravetter, Larry B. WallnauPublisher:Cengage Learning
  Elementary Statistics: Picturing the World (7th E...StatisticsISBN:9780134683416Author:Ron Larson, Betsy FarberPublisher:PEARSON
 The Basic Practice of StatisticsStatisticsISBN:9781319042578Author:David S. Moore, William I. Notz, Michael A. FlignerPublisher:W. H. Freeman
 Introduction to the Practice of StatisticsStatisticsISBN:9781319013387Author:David S. Moore, George P. McCabe, Bruce A. CraigPublisher:W. H. Freeman
MATLAB: An Introduction with Applications
Statistics
ISBN:9781119256830
Author:Amos Gilat
Publisher:John Wiley & Sons Inc
Probability and Statistics for Engineering and th...
Statistics
ISBN:9781305251809
Author:Jay L. Devore
Publisher:Cengage Learning
Statistics for The Behavioral Sciences (MindTap C...
Statistics
ISBN:9781305504912
Author:Frederick J Gravetter, Larry B. Wallnau
Publisher:Cengage Learning
Elementary Statistics: Picturing the World (7th E...
Statistics
ISBN:9780134683416
Author:Ron Larson, Betsy Farber
Publisher:PEARSON
The Basic Practice of Statistics
Statistics
ISBN:9781319042578
Author:David S. Moore, William I. Notz, Michael A. Fligner
Publisher:W. H. Freeman
Introduction to the Practice of Statistics
Statistics
ISBN:9781319013387
Author:David S. Moore, George P. McCabe, Bruce A. Craig
Publisher:W. H. Freeman