
MATLAB: An Introduction with Applications
6th Edition
ISBN: 9781119256830
Author: Amos Gilat
Publisher: John Wiley & Sons Inc
expand_more
expand_more
format_list_bulleted
Related questions
Question
thumb_up100%
❎❎✅♦️♦️♦️✅✅✅✅♦️
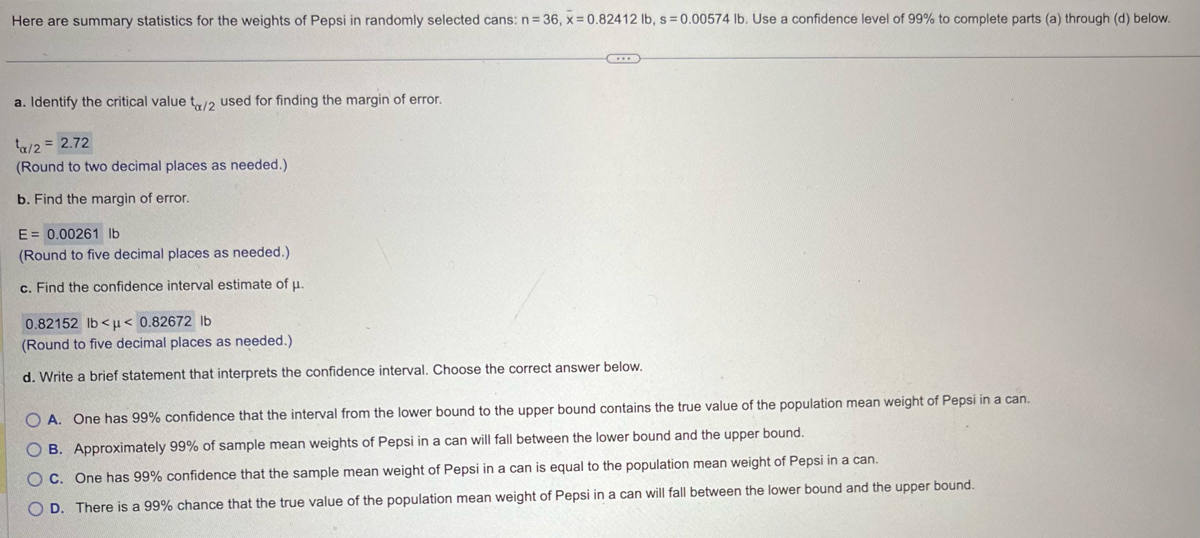

Transcribed Image Text:Here are summary statistics for the weights of Pepsi in randomly selected cans: n=36, x=0.82412 lb, s = 0.00574 lb. Use a confidence level of 99% to complete parts (a) through (d) below.
a. Identify the critical value tx/2 used for finding the margin of error.
¹a/2 = 2.72
(Round to two decimal places as needed.)
b. Find the margin of error.
E = 0.00261 lb
(Round to five decimal places as needed.)
c. Find the confidence interval estimate of μ.
0.82152 lb<μ< 0.82672 lb
(Round to five decimal places as needed.)
d. Write a brief statement that interprets the confidence interval. Choose the correct answer below.
OA. One has 99% confidence that the interval from the lower bound to the upper bound contains the true value of the population mean weight of Pepsi in a can.
OB. Approximately 99% of sample mean weights of Pepsi in a can will fall between the lower bound and the upper bound.
OC. One has 99% confidence that the sample mean weight of Pepsi in a can is equal to the population mean weight of Pepsi in a can.
OD. There is a 99% chance that the true value of the population mean weight of Pepsi in a can will fall between the lower bound and the upper bound.
Expert Solution
This question has been solved!
Explore an expertly crafted, step-by-step solution for a thorough understanding of key concepts.

Step by stepSolved in 2 steps

Knowledge Booster

Similar questions
Recommended textbooks for you
- MATLAB: An Introduction with ApplicationsStatisticsISBN:9781119256830Author:Amos GilatPublisher:John Wiley & Sons Inc
 Probability and Statistics for Engineering and th...StatisticsISBN:9781305251809Author:Jay L. DevorePublisher:Cengage Learning
 Statistics for The Behavioral Sciences (MindTap C...StatisticsISBN:9781305504912Author:Frederick J Gravetter, Larry B. WallnauPublisher:Cengage Learning
  Elementary Statistics: Picturing the World (7th E...StatisticsISBN:9780134683416Author:Ron Larson, Betsy FarberPublisher:PEARSON
 The Basic Practice of StatisticsStatisticsISBN:9781319042578Author:David S. Moore, William I. Notz, Michael A. FlignerPublisher:W. H. Freeman
 Introduction to the Practice of StatisticsStatisticsISBN:9781319013387Author:David S. Moore, George P. McCabe, Bruce A. CraigPublisher:W. H. Freeman
MATLAB: An Introduction with Applications
Statistics
ISBN:9781119256830
Author:Amos Gilat
Publisher:John Wiley & Sons Inc
Probability and Statistics for Engineering and th...
Statistics
ISBN:9781305251809
Author:Jay L. Devore
Publisher:Cengage Learning
Statistics for The Behavioral Sciences (MindTap C...
Statistics
ISBN:9781305504912
Author:Frederick J Gravetter, Larry B. Wallnau
Publisher:Cengage Learning
Elementary Statistics: Picturing the World (7th E...
Statistics
ISBN:9780134683416
Author:Ron Larson, Betsy Farber
Publisher:PEARSON
The Basic Practice of Statistics
Statistics
ISBN:9781319042578
Author:David S. Moore, William I. Notz, Michael A. Fligner
Publisher:W. H. Freeman
Introduction to the Practice of Statistics
Statistics
ISBN:9781319013387
Author:David S. Moore, George P. McCabe, Bruce A. Craig
Publisher:W. H. Freeman