MATLAB: An Introduction with Applications
6th Edition
ISBN: 9781119256830
Author: Amos Gilat
Publisher: John Wiley & Sons Inc
expand_more
expand_more
format_list_bulleted
Question

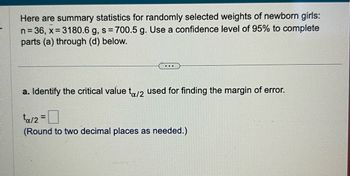
Transcribed Image Text:Here are summary statistics for randomly selected weights of newborn girls:
n = 36, x=3180.6 g, s = 700.5 g. Use a confidence level of 95% to complete
parts (a) through (d) below.
..
a. Identify the critical value to/2 used for finding the margin of error.
tα/2 =
(Round to two decimal places as needed.)

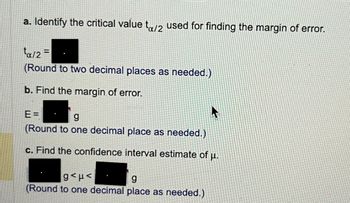
Transcribed Image Text:a. Identify the critical value to/2 used for finding the margin of error.
ta/2=
(Round to two decimal places as needed.)
b. Find the margin of error.
E=
g
(Round to one decimal place as needed.)
c. Find the confidence interval estimate of μ.
ghp<
g
(Round to one decimal place as needed.)
Expert Solution
This question has been solved!
Explore an expertly crafted, step-by-step solution for a thorough understanding of key concepts.
This is a popular solution
Trending nowThis is a popular solution!
Step by stepSolved in 4 steps with 1 images

Knowledge Booster
Similar questions
- Heights for teenage boys and girls were calculated. The mean height for the sample of 51 boys was 183 cm and the variance was 66. For the sample of 71 girls, the mean was 173 cm and the variance was 61. There is no reason to assume the variances would be equal. Estimate how much taller teenage boys are using a 87% confidence level. Express this in the (point estimate) ± (margin of error) format. Round answers to 2 decimal places. Harrow_forwardThe hip width x of adult females is normally distributed with a mean of 38.3 cm and a standard deviation of 4.37 cm. The maximum width of an aircraft seat that will accommodate 86% of all adult women is about: (Give your answer to one decimal places if necessary.)arrow_forwardFor a data set of the pulse rates for a sample of adult females, the lowest pulse rate is 33 beats per minute, the mean of the listed pulse rates is x =74.0 beats per minute, and their standard deviation iss = 13.2 beats per minute. a. What is the difference between the pulse rate of 33 beats per minute and the mean pulse rate of the females? b. How many standard deviations is that [the difference found in part (a)]? c. Convert the pulse rate of 33 beats per minutes to a z score. d. If we consider pulse rates that convert to z scores between -2 and 2 to be neither significantly low nor significantly high, is the pulse rate of 33 beats per minute significant? a. The difference is beats per minute. (Type an integer or a decimal. Do not round.) b. The difference is standard deviations. (Round to two decimal as needed.) c. The z score is z= (Round to two decimal places as needed.) d. The lowest pulse rate isarrow_forward
- Suppose that the heights of adult men in the United States are normally distributed with a mean of 69 inches and a standard deviation of 3 inches. What proportion of adult men in the United States is at least 6 feet tall? (Hint 6 feet=72 inches.) Round answer to at least 4 decimal places.arrow_forwardThe weights for a baby boy is normally distributed with a mean score of 7lbs and a standard deviation of 0.8lbs. determine the following:arrow_forwardIn a measurement of B two results were obtained, B1 = (8.3+/- 0.78) mT and B2 = (8.81+/- 0.20) mT . The error on the weighted/arithmetic mean is (Report your answer in mT with 3 significant figures)arrow_forward
- Assume that a sample is used to estimate a population mean μ. Find the margin of error M.E. that corresponds to a sample of size 22 with a mean of 62.5 and a standard deviation of 9.6 at a confidence level of 80%.Report ME accurate to one decimal place because the sample statistics are presented with this accuracy. M.E. =arrow_forwardAdult men have heights with a mean of 69.0 inches and a standard deviation of 2.8 inches. Find the height of a man with a z-score of 0.8214 (to 4 decimal places) Question Help: Written Example > Next Question 10 %23 2 3 7 E RI 0O 1P A D F commandarrow_forwardAssume that adults have IQ scores that are normally distributed with mean of 99.6 and a standard deviation 17.4. Find the first quartile Q,, which is the IQ score separating the bottom 25% from the top 75%. (Hint: Draw a graph.) The first quartile is (Type an integer or decimal rounded to one decimal place as needed.)arrow_forward
arrow_back_ios
arrow_forward_ios
Recommended textbooks for you
 MATLAB: An Introduction with ApplicationsStatisticsISBN:9781119256830Author:Amos GilatPublisher:John Wiley & Sons Inc
 Probability and Statistics for Engineering and th...StatisticsISBN:9781305251809Author:Jay L. DevorePublisher:Cengage Learning
 Statistics for The Behavioral Sciences (MindTap C...StatisticsISBN:9781305504912Author:Frederick J Gravetter, Larry B. WallnauPublisher:Cengage Learning
 Elementary Statistics: Picturing the World (7th E...StatisticsISBN:9780134683416Author:Ron Larson, Betsy FarberPublisher:PEARSON
 The Basic Practice of StatisticsStatisticsISBN:9781319042578Author:David S. Moore, William I. Notz, Michael A. FlignerPublisher:W. H. Freeman
 Introduction to the Practice of StatisticsStatisticsISBN:9781319013387Author:David S. Moore, George P. McCabe, Bruce A. CraigPublisher:W. H. Freeman

MATLAB: An Introduction with Applications
Statistics
ISBN:9781119256830
Author:Amos Gilat
Publisher:John Wiley & Sons Inc

Probability and Statistics for Engineering and th...
Statistics
ISBN:9781305251809
Author:Jay L. Devore
Publisher:Cengage Learning

Statistics for The Behavioral Sciences (MindTap C...
Statistics
ISBN:9781305504912
Author:Frederick J Gravetter, Larry B. Wallnau
Publisher:Cengage Learning

Elementary Statistics: Picturing the World (7th E...
Statistics
ISBN:9780134683416
Author:Ron Larson, Betsy Farber
Publisher:PEARSON

The Basic Practice of Statistics
Statistics
ISBN:9781319042578
Author:David S. Moore, William I. Notz, Michael A. Fligner
Publisher:W. H. Freeman

Introduction to the Practice of Statistics
Statistics
ISBN:9781319013387
Author:David S. Moore, George P. McCabe, Bruce A. Craig
Publisher:W. H. Freeman