
MATLAB: An Introduction with Applications
6th Edition
ISBN: 9781119256830
Author: Amos Gilat
Publisher: John Wiley & Sons Inc
expand_more
expand_more
format_list_bulleted
Related questions
Concept explainers
Topic Video
Question
Hello, I would like to know how to do the rest of the parts in the problem
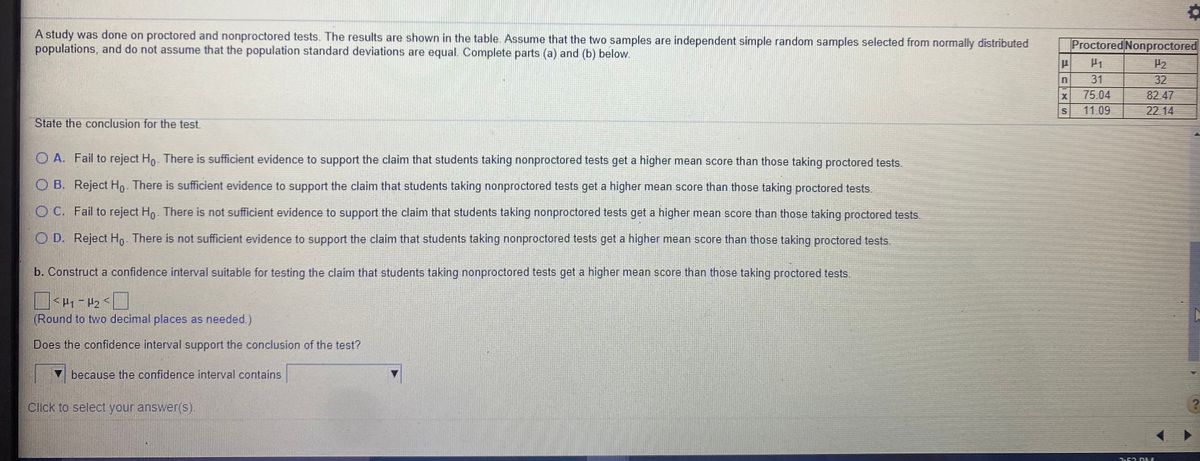

Transcribed Image Text:A study was done on proctored and nonproctored tests. The results are shown in the table. Assume that the two samples are independent simple random samples selected from normally distributed
populations, and do not assume that the population standard deviations are equal. Complete parts (a) and (b) below.
Proctored Nonproctored
H1
P2
31
32
75.04
11.09
82.47
22.14
State the conclusion for the test.
O A. Fail to reject Ho. There is sufficient evidence to support the claim that students taking nonproctored tests get a higher mean score than those taking proctored tests.
O B. Reject Ho. There is sufficient evidence to support the claim that students taking nonproctored tests get a higher mean score than those taking proctored tests.
O C. Fail to reject Ho. There is not sufficient evidence to support the claim that students taking nonproctored tests get a higher mean score than those taking proctored tests.
O D. Reject Ho There is not sufficient evidence to support the claim that students taking nonproctored tests get a higher mean score than those taking proctored tests.
b. Construct a confidence interval suitable for testing the claim that students taking nonproctored tests get a higher mean score than those taking proctored tests.
(Round to two decimal places as needed.)
Does the confidence interval support the conclusion of the test?
because the confidence interval contains
Click to select your answer(s).

Transcribed Image Text:A study was done on proctored and nonproctored tests. The results are shown in the table. Assume that the two samples are independent simple random samples selected from normally distributed
populations, and do not assume that the population standard deviations are equal. Complete parts (a) and (b) below.
Proctored Nonproctored
P2
31
32
75.04
82.47
11.09
22.14
a. Use a 0.01 significance level to test the claim that students taking nonproctored tests get a higher mean score than those taking proctored tests.
What are the null and alternative hypotheses?
O A. Ho H1 H2
O B. Ho H1 = Hz
O D. Ho P1 = H2
O C. Ho H1 = H2
H1: P1 <H2
The test statistic, t, is -1.69. (Round to two decimal places as needed)
The P-value is 0.049. (Round to three decimal places as needed.)
State the conclusion for the test.
Coilto rninnt U
There in ouffiniant auidenos to sunnart tha alaies that atudanta taldna nnnBEA otoradtosta not a hiahor mAan aoars than thaoo takiaa pEAotarad tant.
Click to select your answer(s).
3:51 PM
Expert Solution
This question has been solved!
Explore an expertly crafted, step-by-step solution for a thorough understanding of key concepts.

This is a popular solution

Trending nowThis is a popular solution!

Step by stepSolved in 3 steps

Knowledge Booster


Learn more about
Need a deep-dive on the concept behind this application? Look no further. Learn more about this topic, statistics and related others by exploring similar questions and additional content below.Similar questions
- please do not provide solution in image format thank you!arrow_forwardbut the answer to the problem is "not possible" not 0. I have to add parenthesis to the first line to make the problem look exactly like like one that I attached the picture ofarrow_forwardHello, Can you explain problem c) I do not understand the solution.arrow_forward
- Please show detailed step-by-step explanation and solution for each problem (problem #2, problem #3, problem #4, problem #5, and problem #6). Please use the results of problems #2 and problems #3 to solve and show your work for problems #5 and problems #6 (just like the hint stated).arrow_forwardA tortoise and hare are competing in a 400-meter race. The arrogant hare gives the tortoise a 220-meter head start. When the start gun is fired, the hare begins running at a constant speed of 3.5 meters per second and the tortoise begins crawling at constant speed of 1.5 meters per second. Take out a piece of paper and read the above problem context again. You will prepare your written work and solutions on your own paper and upload it and the end of this question. Complete the problem solving process by: i. reading and re-reading the problem to identify the quantities in the situation; ii. making a drawing to represent the relevant quantities in the situation; iii. and defining the variable t to represent the number of seconds since the start of the race. a. Define a function f to determine the distance of the tortoise from the finish line in terms of the number of seconds, t, since the start of the race. Preview Solve f(t) = 0 and describe what your solution represents. t = Preview…arrow_forwardI am only needing help on the second picture I can not figure out how to simply this.arrow_forward
arrow_back_ios
arrow_forward_ios
Recommended textbooks for you
- MATLAB: An Introduction with ApplicationsStatisticsISBN:9781119256830Author:Amos GilatPublisher:John Wiley & Sons Inc
 Probability and Statistics for Engineering and th...StatisticsISBN:9781305251809Author:Jay L. DevorePublisher:Cengage Learning
 Statistics for The Behavioral Sciences (MindTap C...StatisticsISBN:9781305504912Author:Frederick J Gravetter, Larry B. WallnauPublisher:Cengage Learning
  Elementary Statistics: Picturing the World (7th E...StatisticsISBN:9780134683416Author:Ron Larson, Betsy FarberPublisher:PEARSON
 The Basic Practice of StatisticsStatisticsISBN:9781319042578Author:David S. Moore, William I. Notz, Michael A. FlignerPublisher:W. H. Freeman
 Introduction to the Practice of StatisticsStatisticsISBN:9781319013387Author:David S. Moore, George P. McCabe, Bruce A. CraigPublisher:W. H. Freeman
MATLAB: An Introduction with Applications
Statistics
ISBN:9781119256830
Author:Amos Gilat
Publisher:John Wiley & Sons Inc
Probability and Statistics for Engineering and th...
Statistics
ISBN:9781305251809
Author:Jay L. Devore
Publisher:Cengage Learning
Statistics for The Behavioral Sciences (MindTap C...
Statistics
ISBN:9781305504912
Author:Frederick J Gravetter, Larry B. Wallnau
Publisher:Cengage Learning
Elementary Statistics: Picturing the World (7th E...
Statistics
ISBN:9780134683416
Author:Ron Larson, Betsy Farber
Publisher:PEARSON
The Basic Practice of Statistics
Statistics
ISBN:9781319042578
Author:David S. Moore, William I. Notz, Michael A. Fligner
Publisher:W. H. Freeman
Introduction to the Practice of Statistics
Statistics
ISBN:9781319013387
Author:David S. Moore, George P. McCabe, Bruce A. Craig
Publisher:W. H. Freeman