
Calculus: Early Transcendentals
8th Edition
ISBN: 9781285741550
Author: James Stewart
Publisher: Cengage Learning
expand_more
expand_more
format_list_bulleted
Related questions
Question
thumb_up100%
Hello,
I need to evaluate the limits below but the grahp is made on paint, sorry about that.
1. lim x---> -3^+
2. lim x---> 0^-
3. lim x---> 0
4. lim x----> 6^+
The (^) means that the signs (+) or (-) are on top of the numbers.
Sorry if the graph is unreadable, thank you so much in advance!
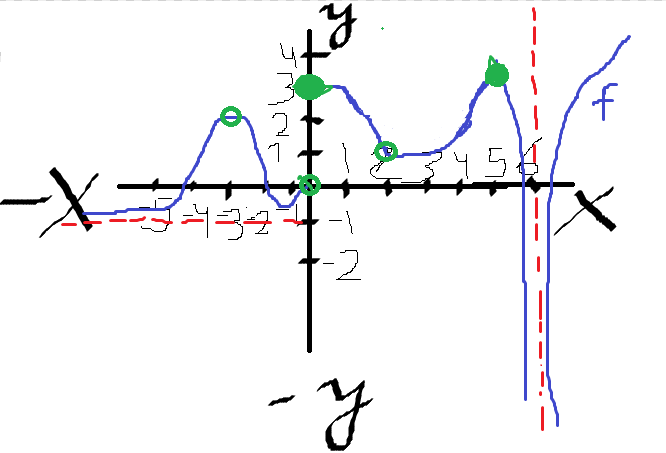

Transcribed Image Text:The image presents a graph on a Cartesian coordinate system, illustrating a mathematical function.
### Components of the Graph:
- **Axes**:
- The horizontal line represents the x-axis, labeled as "X" on the positive side and "-X" on the negative side.
- The vertical line represents the y-axis, labeled as "y" on the positive side and "-y" on the negative side.
- **Graph of the Function**:
- The graph is drawn in blue and represents the function \( f(x) \).
- The curve shows fluctuations as it moves from left to right, indicating changes in the value of \( f(x) \) with respect to \( x \).
- **Highlighted Points**:
- Several points on the curve are marked with green circles, indicating key points or intersections.
- Some points are larger, possibly indicating maximum or minimum values on the curve.
- **Asymptote**:
- A red dashed vertical line is present near \( x = 6 \), suggesting a vertical asymptote where the function approaches infinity.
- **X-axis Overview**:
- The negative side of the x-axis has points labeled from -4 to 0.
- The positive side extends from 0 to 6.
- **Y-axis Overview**:
- The y-axis is labeled from -2 to 4, which captures the range of the function shown.
### Interpretation:
- The graph depicts a polynomial or rational function with maximum and minimum values evident from the peaks and troughs.
- The vertical asymptote indicates values where the function does not exist, typically representing division by zero in rational functions.
- The function exhibits periodic behavior with apparent oscillations, which can be associated with certain trigonometric functions or other complex equations.
This graph serves as a visual representation of function behavior, useful for analyzing continuity, limits, and points of interest such as extrema and asymptotic behavior.
Expert Solution
This question has been solved!
Explore an expertly crafted, step-by-step solution for a thorough understanding of key concepts.

This is a popular solution

Trending nowThis is a popular solution!

Step by stepSolved in 3 steps with 3 images

Knowledge Booster

Similar questions
arrow_back_ios
arrow_forward_ios
Recommended textbooks for you
- Calculus: Early TranscendentalsCalculusISBN:9781285741550Author:James StewartPublisher:Cengage Learning
 Thomas' Calculus (14th Edition)CalculusISBN:9780134438986Author:Joel R. Hass, Christopher E. Heil, Maurice D. WeirPublisher:PEARSON
 Calculus: Early Transcendentals (3rd Edition)CalculusISBN:9780134763644Author:William L. Briggs, Lyle Cochran, Bernard Gillett, Eric SchulzPublisher:PEARSON
  Calculus: Early TranscendentalsCalculusISBN:9781319050740Author:Jon Rogawski, Colin Adams, Robert FranzosaPublisher:W. H. Freeman
 Calculus: Early Transcendental FunctionsCalculusISBN:9781337552516Author:Ron Larson, Bruce H. EdwardsPublisher:Cengage Learning
Calculus: Early Transcendentals
Calculus
ISBN:9781285741550
Author:James Stewart
Publisher:Cengage Learning
Thomas' Calculus (14th Edition)
Calculus
ISBN:9780134438986
Author:Joel R. Hass, Christopher E. Heil, Maurice D. Weir
Publisher:PEARSON
Calculus: Early Transcendentals (3rd Edition)
Calculus
ISBN:9780134763644
Author:William L. Briggs, Lyle Cochran, Bernard Gillett, Eric Schulz
Publisher:PEARSON
Calculus: Early Transcendentals
Calculus
ISBN:9781319050740
Author:Jon Rogawski, Colin Adams, Robert Franzosa
Publisher:W. H. Freeman
Calculus: Early Transcendental Functions
Calculus
ISBN:9781337552516
Author:Ron Larson, Bruce H. Edwards
Publisher:Cengage Learning