
MATLAB: An Introduction with Applications
6th Edition
ISBN: 9781119256830
Author: Amos Gilat
Publisher: John Wiley & Sons Inc
expand_more
expand_more
format_list_bulleted
Related questions
Question
Heights of WOMEN in the U.S. are
Adult women height: µ = 63.8 inches with σ = 2.8 inches.
- From the given frequency distribution, we see that _____ of the 52 women in our RCCC sample were between 62 and 69 inches tall, which would be approximately _____ % (0 decimal places). This is __________ percentage points _______________ (above or below) that of the U.S. population. (Note: Include 62 and 69 inches.)
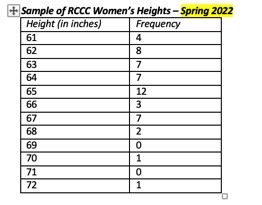

Transcribed Image Text:+Sample of RCCC Women's Heights - Spring 2022
Height (in inches)
Frequency
61
4
8
7
7
12
3
7
CC388688REN
62
64
65
66
67
69
70
71
72
2
0
1
0
1
Expert Solution
This question has been solved!
Explore an expertly crafted, step-by-step solution for a thorough understanding of key concepts.

This is a popular solution

Trending nowThis is a popular solution!

Step by stepSolved in 2 steps with 1 images

Knowledge Booster

Similar questions
- You generate a scatter plot using Minitab. You then have Minitab plot the regression line and report the equation and the r2 value. The regression equation is reported as y=43.41x+77.98 and the r2=0.2025.What is the correlation coefficient for this data set? r =arrow_forwardQuestion 1 Choose the appropriate unbiased estimate for each parameter. the population mean the population variance the population proportion the sample mean the sample variance the sample proportionarrow_forwardQuestion 9 The annual rainfall in a certain region is approximately normally distributed with mean 43 inches and standard deviation 6 inches. Use the Cumulative Z-Score Table to answer the questions below. Write your answers as a percent with two decimal places. Hint a) What percentage of years will have an annual rainfall of less than 37 inches? b) What percentage of years will have an annual rainfall of more than 40.6 inches? c) What percentage of years will have an annual rainfall of between 28.6 inches and 45.7 inches? Z-Score Table Question Help: Video 1 D Video 2 instructor Submit Question earcharrow_forward
- QUESTION 5 Fifty-one (51) statistics students were asked how much sleep they get per school night (rounded to the nearest hour). The results are as shown in the following frequency distribution table. Find the 95th percentile. State your result/answer as a value with exactly one digit after the decimal. Values Frequency CumulativeFrequency 4 2 2 5 5 7 6 7 14 7 11 25 8 16 41 9 6 47 10 4 51arrow_forwardA national survey asked people, "How often do you eat out for dinner, instead of at home?" The frequencies were as follows. Complete parts (a) through (g). Response Never Rarely Sometimes Most of the time Always Frequency 262 458 926 250 95 (a) Construct a relative frequency distribution of the data. Relative Frequency Response Never Rarely Sometimes Most of the time Always (Round to three decimal places as needed.) (b) What percentage of respondents answered "Always"? % (Round to one decimal place as needed.) (c) What percentage of respondents answered "Never" or "Rarely"? % (Round to one decimal place as needed.) (d) Construct a frequency bar graph. Choose the correct answer below.arrow_forwardQuestion 6 3.1 Question: Which of the following commands calculates the mean in Excel? =MEAN =AVERAGE Question 7 31 0 TIarrow_forward
- The following boxplots provide information on the average monthly temperatures, in degrees Celsius, for the 24 months in 2017-18, in the cities of Moscow (Russia), Melbourne (Australia), and San Francisco (United States). Use the graphs to answer the following questions.arrow_forwardAnswer these two math questionsarrow_forward0 Question 3 What is the Relative Frequency for the data x=3 given in the frequency table below: X2345 6 879 f 423223T 20% 15% 10% None of these answersarrow_forward
- Question 11 Statisticians at ESPN were interested in the winning margins of teams during the 52 Super Bowls. Table values were rounded to 1 decimal, when appropriate Frequency Relative Cumulative Number of Points Frequency (%) Frequency a What is the value of A b. What is the value of B c. What is the value of C d. What is the value of D? e. What is the value of E f. What is the value of F What is the value of G 1-5 6-10 11-15 16-20 21-25 26-30 31-35 36-40 41-45 HABBA33IB 14 А 8 8 4 h Explain what 19.2 in the relative frequency % column) means in the context of the situation Explain what 32 in the cumulative frequency column) means in the context of the situation C 19.2 15.4 15.4 7.7 5.8 5.8 1.9 1.9 2-84063NR 14 D 47 50 E 52 Cumulative Relative Frequency (%) 26.9 F 61.5 76.9 84.6 90.4 G 98.1 100arrow_forwardQuestion 10 A normally distributed sample has a mean = 5. and SD = 3.8, %3D 1. Find z for x = 4.7 2. Find x if z = 3.2arrow_forwardRefer to the accompanying data set and use the 30 screw lengths to construct a frequency Begin with a lower classlimit of 3.720 in., and use a class width of 0.010 in. The screws were labeled as having a length of 3 3 / 4 in. 1 Click on icon to view the data. Complete the frequency distribution below. Length (in.) Frequency 3.720 − − − − − (Type integers or decimals rounded to the nearest thousandth as needed.) 1: Data Table Screw Lengths (inches) 3.765 3.757 3.741 3.755 3.736 3.746 3.756 3.722 3.755 3.758 3.754 3.744 3.743 3.735 3.753 3.755 3.737 3.736 3.741 3.742 3.742 3.766 3.753 3.759 3.748 3.736 3.758 3.751 3.752 3.748arrow_forward
arrow_back_ios
SEE MORE QUESTIONS
arrow_forward_ios
Recommended textbooks for you
- MATLAB: An Introduction with ApplicationsStatisticsISBN:9781119256830Author:Amos GilatPublisher:John Wiley & Sons Inc
 Probability and Statistics for Engineering and th...StatisticsISBN:9781305251809Author:Jay L. DevorePublisher:Cengage Learning
 Statistics for The Behavioral Sciences (MindTap C...StatisticsISBN:9781305504912Author:Frederick J Gravetter, Larry B. WallnauPublisher:Cengage Learning
  Elementary Statistics: Picturing the World (7th E...StatisticsISBN:9780134683416Author:Ron Larson, Betsy FarberPublisher:PEARSON
 The Basic Practice of StatisticsStatisticsISBN:9781319042578Author:David S. Moore, William I. Notz, Michael A. FlignerPublisher:W. H. Freeman
 Introduction to the Practice of StatisticsStatisticsISBN:9781319013387Author:David S. Moore, George P. McCabe, Bruce A. CraigPublisher:W. H. Freeman
MATLAB: An Introduction with Applications
Statistics
ISBN:9781119256830
Author:Amos Gilat
Publisher:John Wiley & Sons Inc
Probability and Statistics for Engineering and th...
Statistics
ISBN:9781305251809
Author:Jay L. Devore
Publisher:Cengage Learning
Statistics for The Behavioral Sciences (MindTap C...
Statistics
ISBN:9781305504912
Author:Frederick J Gravetter, Larry B. Wallnau
Publisher:Cengage Learning
Elementary Statistics: Picturing the World (7th E...
Statistics
ISBN:9780134683416
Author:Ron Larson, Betsy Farber
Publisher:PEARSON
The Basic Practice of Statistics
Statistics
ISBN:9781319042578
Author:David S. Moore, William I. Notz, Michael A. Fligner
Publisher:W. H. Freeman
Introduction to the Practice of Statistics
Statistics
ISBN:9781319013387
Author:David S. Moore, George P. McCabe, Bruce A. Craig
Publisher:W. H. Freeman