
Related questions
Check for accuracy and respond the last questions
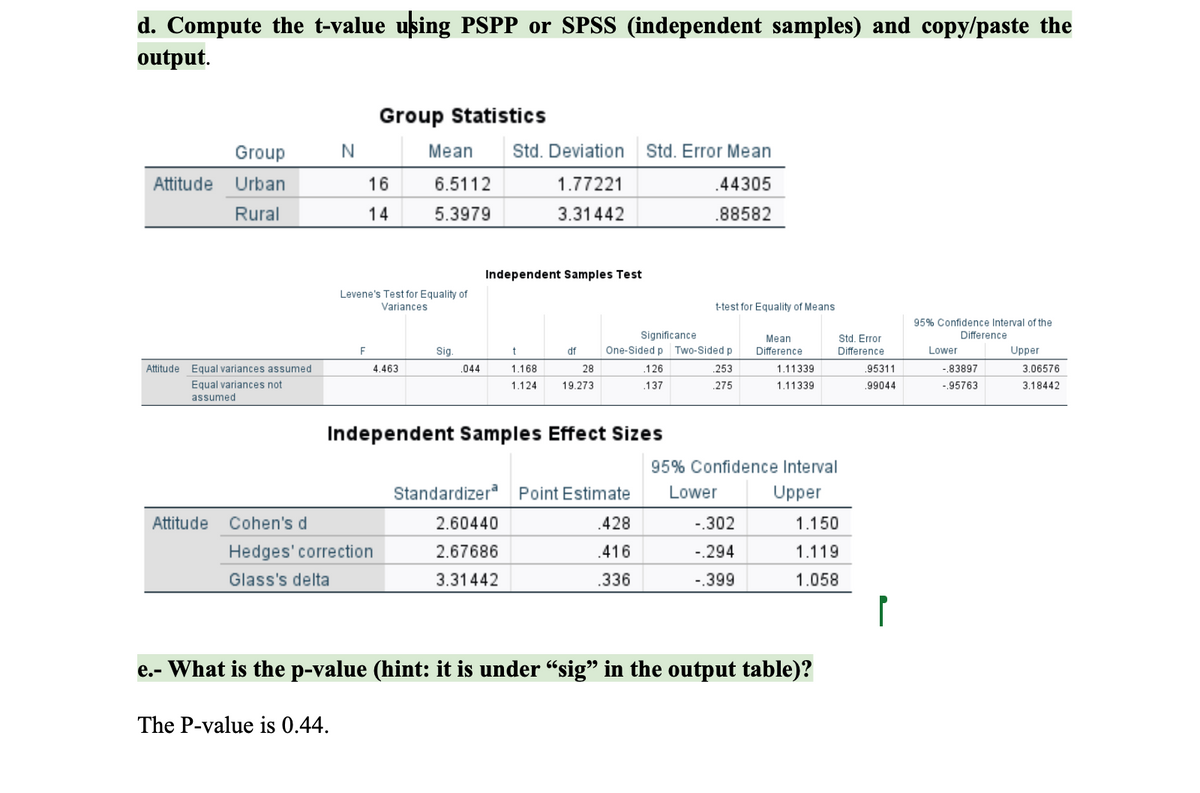
2. For this problem, use Chapter 11 Data Set 3. We want to know if urban and rural residents both have the same attitude toward gun control.
a. What is the null hypothesis?
The null hypothesis concludes that there is no difference in attitudes toward gun control between urban and rural residents.
b. What is the research hypothesis?
The research hypothesis suggests that there is a difference in attitudes toward gun control between urban and rural residents.
c. Will you be conducting a one-tailed or a two-tailed test? Why?
In this case I would conduct a two-tailed test because i’m interested in whether there is a difference in attitudes toward gun control between urban and rural residents, regardless of which direction that difference follows.
e.- What is the p-value (hint: it is under “sig” in the output table)?
The P-value is 0.44.
- Do you reject the null hypothesis or fail to reject the null? What do you conclude about urban and rural residents’ attitudes toward gun control?
g. What is the size of the effect? Is this a small, medium, or large effect? Show all of your work. (Use the formula on page 208 in Chapter 11 and the guidelines for interpreting effect sizes on page 196 in Chapter 10). Use the attached document. You can check your result by using the effect size calculator at https://lbecker.uccs.edu/.


Trending nowThis is a popular solution!

Step by stepSolved in 3 steps with 3 images


- find : c ) Does data provide evid. of an association between age and opinion of brand? Justify your answer.arrow_forwardConsider the following data for this question B1 B2 A1 M = 10 M = 20 A2 M = 30 M = ? The above data, what value for the missing mean would result in no interaction between A and B? Select one: a. 20 b. 30 c. 10 d. 40arrow_forwardcan you please help me with my stats homework?arrow_forward
- 40 30 20 10 0 00 : 00000 -1.00 00000 -0.75 3. A statistics student seeking part-time employment as a New York City cab driver is trying to decide between driving a yellow cab or a green cab and examines tip amounts to help in making the decision. Using data from the New York City Taxi & Limousine Commission (http:// www.nyc.gov/html/tlc/html/about/trip_record_data.shtml), the stu- dent examines tip amounts from 25 randomly selected green cab fares and tip amounts from 25 randomly selected yellow cab fares. Graphs and summary statistics of the sample data from green cabs (G) and yellow cabs (Y) are shown. Green Cab ooooooooo000 Yellow Cab oooooooooooo 우1 -0.50 88.8. COCO 2 - 3 -0.25 4 5 Amount of Trip 0.go null = 0 Source: http://www.nyc.gov/html/tlc/html/about/trip_record_data.shtml Because each sample includes outliers, a two-sample t-test for H₁ a difference in means is not appropriate to test the hypotheses: Ho: MG My = 0, Ha:MG My # 0. The student simulates a distri- µy bution of…arrow_forwardConsider the following scenario and answer the questions below: The ornithologist decided to investigate the effect of temperature on the migration of North American birds. Develop a hypothesis in the appropriate format. Identify the independent variable. Identify the dependent variable. Plan an investigation (what would she do to collect data?). Did she engage in basic science or applied science? Explain. Did she engage in inductive or deductive reasoning? Explainarrow_forward1. Which of the following is an unbiased point estimator of a population proportion? A. p-value B. ?C. ?0D. ?̅arrow_forward
- 3. You would like to determine if there is a statistical relationship between the amount of caffein in a cup of coffee and their sales at their coffee franchises. The data is included in the set "Coffee by the Cup". Here is information about the variables. Variable Caffeine Cups Sold Measurement Amount of caffeine in one cup Number of cups of the coffee Units Milligrams Cups sold sold at all of the franchises a. Which variable is the explanatory variable and which variable is the response variable? b. Construct a scatterplot of the data. Based upon the scatterplot is there a linear relationship between the amount of caffeine in one cup of the coffee and the number of cups of coffee sold? Justify your reasoning using the scatterplot. c. Run a t-test for correlation using technology. Make sure you include the p-value and the printout. According to the t-test, is there a statistical relationship between the amount of caffeine in a cup of coffee and the number of cups sold? Justify your…arrow_forwardWhich one of the following conclusions could be drawn from a descriptive study? Question options: a. Concrete experiences help students understand abstract ideas better. b.Students are more likely to appreciate classical music if they are exposed to it on a regular basis. c. Students do better in school when they have warm, supportive relationships with their teachers. d. Approximately 80% of the students at Southside High School are planning to go to college.arrow_forwarda. Is there a main effect of Drug Dose? Explain. b. Is there a main effect of Sex? Explain. c. Is there an interaction between Sex and Drug Dose? Explain.arrow_forward
- 1. Identify whether the variable in the information below is qualitative or quantitative. A nurse collects blood from kids and measure their blood-sugar content. This measure of blood-sugar concentration is a variable. a. quantitative b. qualitative c. qualitative as well as quantitative d. neither qualitative nor quantitative 2. Identify the technique for gathering data in the study below. A pharmaceutical firm wants test the effectiveness of a new drug. It wants to know if the new drug is significantly stronger than the conventional drug. This is a/an study. a. observational b. experimental c. census d. sampling 3. You want to plot a frequency graph of daily rainfall, with rainfalls (inches) on the horizontal axis. You will use a a. bar chart b. histogram c. cumulative frequency d. best fit line 4. Frequency of categorical data are displayed using a a. bar chart b. histogram c. time series graph d. best fit linearrow_forwardI only need help with the last 2 pleasearrow_forwardThis is a follow up question please answer botharrow_forward
- MATLAB: An Introduction with ApplicationsStatisticsISBN:9781119256830Author:Amos GilatPublisher:John Wiley & Sons Inc
 Probability and Statistics for Engineering and th...StatisticsISBN:9781305251809Author:Jay L. DevorePublisher:Cengage Learning
 Statistics for The Behavioral Sciences (MindTap C...StatisticsISBN:9781305504912Author:Frederick J Gravetter, Larry B. WallnauPublisher:Cengage Learning
  Elementary Statistics: Picturing the World (7th E...StatisticsISBN:9780134683416Author:Ron Larson, Betsy FarberPublisher:PEARSON
 The Basic Practice of StatisticsStatisticsISBN:9781319042578Author:David S. Moore, William I. Notz, Michael A. FlignerPublisher:W. H. Freeman
 Introduction to the Practice of StatisticsStatisticsISBN:9781319013387Author:David S. Moore, George P. McCabe, Bruce A. CraigPublisher:W. H. Freeman