
A First Course in Probability (10th Edition)
10th Edition
ISBN: 9780134753119
Author: Sheldon Ross
Publisher: PEARSON
expand_more
expand_more
format_list_bulleted
Related questions
Question

Transcribed Image Text:More Info
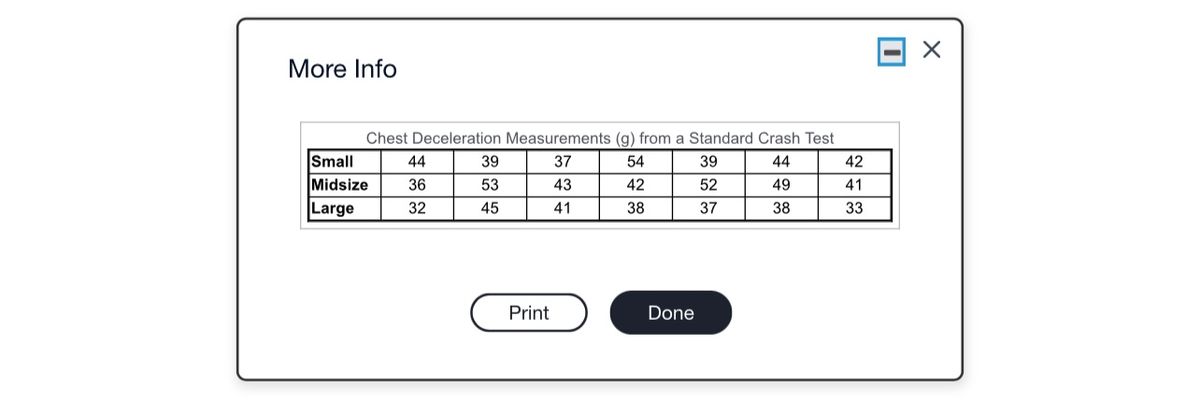
Chest Deceleration Measurements (g) from a Standard Crash Test
Small
Midsize
44
39
37
54
39
44
42
36
53
43
42
52
49
41
Large
32
45
41
38
37
38
33
Print
Done
X

Transcribed Image Text:The accompanying data table contains chest deceleration measurements (in g, where g is the force of gravity) from samples of small, midsize, and large cars.
Shown are the technology results for analysis of variance of this data table. Assume that a researcher plans to use a 0.05 significance level to test the claim that the
different size categories have the same mean chest deceleration in the standard crash test. Complete parts (a) and (b) below.
E Click the icon to view the table of chest deceleration measurements
E Click the icon to view the table of analysis of variance results.
a. What characteristic of the data specifically indicates that one-way analysis of variance should be used?
O A. The measurements are categorized according to the one characteristic of size.
O B. There are three samples of measurements.
O c. The population means are approximately normal.
O D. Nothing specifically indicates that one-way analysis of variance should be used.
b. If the objective is to test the claim that the three size categories have the same mean chest deceleration, why is the method referred to as analysis of variance?
O A. The method is based on showing that the population variances are different.
B. The method is based on showing that the population variances are similar.
C. The method is based on estimates of a common population variance.
D. The method is based on estimates of multiple varying population variances.
More Info
SPSS
Sum of
df
Mean Square
F
Sig.
Results
Squares
Between
Groups
Within
Groups
Total
200.857
2
100.429
3.288
0.061
549.714
18
30.540
750.571
20
Print
Done
Expert Solution
This question has been solved!
Explore an expertly crafted, step-by-step solution for a thorough understanding of key concepts.

Step by stepSolved in 2 steps

Knowledge Booster

Similar questions
- Need help with 5,5,6arrow_forwardThis research was conducted with Korean adolescents in the Los Angeles area. Would you be willing to generalize the results of this study to Korean adolescents who live in other regions of the country? Why or why not.arrow_forwardplease don't provide hand writtin solution....arrow_forward
- Please answer the question contained in the following picturearrow_forwardQualitative researchers should view the opinions of other researchers about the themes derived from data analysis as biased. This is because other researchers would not be as familiar with the results as the researcher. True False A researcher has conducted a crosstabs analysis to understand the distribution of income across 3 different gender groups (male, female and non-binary). They notes that the Chi-square test produced an asymptotic significance level of 0.027. What does this suggest? (pick the most appropriate interpretation) Income does not vary across different genders Income does not differ across the different grouops There are significant differences in the distribution of income for the male, female and non-binary groups The male group has sufficiently more income compared to the female and non-binary groupsarrow_forwardAn engineer designed a valve that will regulate water pressure on an automobile engine. The engineer designed the valve such that it would produce a mean pressure of 5.5 pounds/square inch. It is believed that the valve performs above the specifications. The valve was tested on 24 engines and the mean pressure was 5.7 pounds/square inch with a variance of 0.49. A level of significance of 0.01 will be used. Assume the population distribution is approximately normal. Make the decision to reject or fail to reject the null hypothesis.arrow_forward
- Which of the following conclusions is correct for these test results? > bartlett.test(len~river, data=rivers) Bartlett test of homogeneity of variances data: len by river Bartlett's K-squared = 0.61394, df = 4, p-value = 0.5226 %3D Hint* the first line of code should tell you the type of test you are dealing with. There is NO significant difference in variances among the rivers. There is a significant difference in variances among the rivers. There is NO significant difference in means among the rivers.arrow_forwardDescribe a study in which you can use both nonparametric and parametric statistics. A researcher has participants expecting to receive either painful or mild electrical shocks during a study wait in a quarter-full waiting room with other participants. He then measures whether they choose to sit next to other participants or if they sit far away on their own. What is the best test to run for this study and why?arrow_forwardPlease use ANOVAarrow_forward
arrow_back_ios
arrow_forward_ios
Recommended textbooks for you
- A First Course in Probability (10th Edition)ProbabilityISBN:9780134753119Author:Sheldon RossPublisher:PEARSON

A First Course in Probability (10th Edition)
Probability
ISBN:9780134753119
Author:Sheldon Ross
Publisher:PEARSON