
MATLAB: An Introduction with Applications
6th Edition
ISBN: 9781119256830
Author: Amos Gilat
Publisher: John Wiley & Sons Inc
expand_more
expand_more
format_list_bulleted
Related questions
Concept explainers
Topic Video
Question

Transcribed Image Text:**Chi-Square Test for Independence Example**
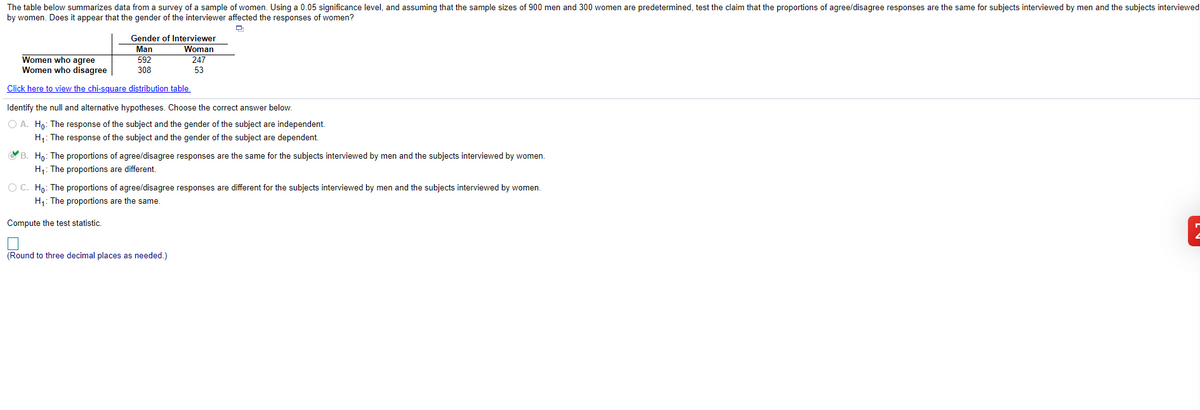
The table below summarizes data from a survey of a sample of women. Using a 0.05 significance level and assuming that the sample sizes of 900 men and 300 women are predetermined, test the claim that the proportions of agree/disagree responses are the same for subjects interviewed by men and the subjects interviewed by women. Does it appear that the gender of the interviewer affected the responses of women?
| | Gender of Interviewer |
|-------------------|-----------------------|
| | Man | Woman |
| Women who agree | 592 | 247 |
| Women who disagree| 308 | 53 |
Click here to view the chi-square distribution table.
**Identify the null and alternative hypotheses. Choose the correct answer below.**
- A. \(H_0\): The response of the subject and the gender of the subject are independent.
\(H_1\): The response of the subject and the gender of the subject are dependent.
- B. **\(H_0\): The proportions of agree/disagree responses are the same for the subjects interviewed by men and the subjects interviewed by women.
\(H_1\): The proportions are different.**
- C. \(H_0\): The proportions of agree/disagree responses are different for the subjects interviewed by men and the subjects interviewed by women.
\(H_1\): The proportions are the same.
**Compute the test statistic.**
(Round to three decimal places as needed.)
**Explanation of Diagram/Table:**
The table provides the number of women who agree or disagree based on the gender of the interviewer—categorized into those interviewed by men and women. This data is used to determine if there's a statistically significant relationship between the gender of the interviewer and the responses provided by women, using a chi-square test for independence.
Expert Solution
This question has been solved!
Explore an expertly crafted, step-by-step solution for a thorough understanding of key concepts.

This is a popular solution

Trending nowThis is a popular solution!

Step by stepSolved in 2 steps with 2 images

Knowledge Booster


Learn more about
Need a deep-dive on the concept behind this application? Look no further. Learn more about this topic, statistics and related others by exploring similar questions and additional content below.Similar questions
- The table below summarizes data from a survey of a sample of women. Using a 0.05 significance level, and assuming that the sample sizes of 900 men and 400 women are predetermined, test the claim that the proportions of agree/disagree responses are the same for subjects interviewed by men and the subjects interviewed by women. Does it appear that the gender of the interviewer affected the responses of women? Q Women who agree Women who disagree Gender of Interviewer Man 555 345 Woman 318 82 Identify the null and alternative hypotheses. Choose the correct answer below. A. Ho: The proportions of agree/disagree responses are the same for the subjects interviewed by men and the subjects interviewed by women. H₁: The proportions are different. B. Ho: The proportions of agree/disagree responses are different for the subjects interviewed by men and the subjects interviewed by women. H₁: The proportions are the same. OC. Ho: The response of the subject and the gender of the subject are…arrow_forwardDifference tests are conducted to determine: A. the representative value in a given set of scores. B. whether two or more groups differ on an outcome. C. if the assumptions of a statistical procedure have been met. D. whether two variables correlate with each other.arrow_forwardThe table below summarizes data from a survey of a sample of women. Using a 0.01 significance level, and assuming that the sample sizes of 900 men and 400 women are predetermined, test the claim that the proportions of agree/disagree responses are the same for subjects interviewed by men and the subjects interviewed by women. Does it appear that the gender of the interviewer affected the responses of women? Gender of Interviewer Man Woman Women who agree 625 330 Women who disagree 275 70 Compute the test statistic, rounding to three decimal places. Find the critical value(s). (Round to three decimal places) What is the conclusion based on the hypothesis test?arrow_forward
- In the US, 46.2% of all people have type O blood, 39.1% have type A blood, 10.4% have type B blood and 4.3% have type AB blood. A researcher wants to see if the distribution of blood type is different for millionaires. The table below shows the results of a random sample of 3116 millionaires. What can be concluded at the a = 0.01 significance level? a. Complete the table by filling in the expected frequencies. Round to the nearest vwhole number: Frequencies of Blood Type Outcome Frequency Expected Frequency 1434 A 1224 В 310 АВ 148 b. What is the correct statistical test to use? Select an answer V c. What are the null and alternative hypotheses? Ho: Blood type and income are independent. O The distribution of blood type for millionaires is not the same as it is for Americans in general. O The distribution of blood type for millionaires is the same as it is for Americans in general. O Blood type and income are dependent.arrow_forwardPerform the hypothesis test that there is a relationship between gender and major 4) at 5% level of significance using the information from the sample below. Math Major English Major Total Male 42 72 114 30 72 09 132 06 204 Female Totalarrow_forwardA study was conducted to determine the proportion of people who dream in black and white instead of color. Among 318 people over the age of 55, 77 dream in black and white, and among 298 people under the age of 25, 16 dream in black and white. Use a 0.05 significance level to test the claim that the proportion of people over 55 who dream in black and white is greater than the proportion for those under 25. Complete parts (a) through (c) below. H4: P1 P2 H: P1 #P2 O D. Ho: P1 SP2 H1: P1#P2 O E. Ho: P1 P2 H1: P1 = P2 O F. Ho: P1 =P2 H1: P1 #P2 Identify the test statistic. z= 6.52 (Round to two decimal places as needed.) Identify the P-value. P-value = 0.000 (Round to three decimal places as needed.) What is the conclusion based on the hypothesis test? The P-value is less than the significance level of a = 0.05, so reject the null hypothesis. There is sufficient evidence to support the claim that the proportion of people over 55 who dream in black and white is greater than the proportion…arrow_forward
- In the General Social Survey, respondents were asked "If your party nominated a woman for President, would you vote for her if she were qualified for the job?" A two-way table summarizing the results for 953 respondents, by gender, is shown below: Gender Female Male Total Vote for female candidate? Yes No 488 66 335 64 823 130 The chi-square test statistic = 3.35. At a significance level of 0.05, what is your conclusion? O The null hypothesis is not rejected: there is no association between gender and support for a female president Total 554 399 953 O The null hypothesis is rejected: there is an association between gender and support for a female president. O The null hypothesis is not rejected: there is an association between gender and support for a female president. ty O The null hypothesis is rejected: there is no association between gender and support for a female president. Q Search or enter address +arrow_forwardThe table below summarizes data from a survey of a sample of women. Using a 0.05 significance level, and assuming that the sample sizes of 800 men and 400 women are predetermined, test the claim that the proportions of agree/disagree responses are the same for subjects interviewed by men and the subjects interviewed by women. Does it appear that the gender of the interviewer affected the responses of women? Gender of Interviewer Man Woman Women who agree 535 344 Women who disagree 265 56 Click here to view the chi-square distribution table. LOADING... Identify the null and alternative hypotheses. Choose the correct answer below. A. H0: The proportions of agree/disagree responses are different for the subjects interviewed by men and the subjects interviewed by women. H1: The proportions are the same. B. H0: The proportions of agree/disagree…arrow_forwardA study was conducted to determine the proportion of people who dream in black and white instead of color. Among 295 people over the age of 55, 64 dream in black and white, and among 312 people under the age of 25, 13 dream in black and white. Use a 0.05 significance level to test the claim that the proportion of people over 55 who dream in black and white is greater than the proportion for those under 25. Complete parts (a) through (c) below. a. Test the claim using a hypothesis test. Consider the first sample to be the sample of people over the age of 55 and the second sample to be the sample of people under the age of 25. What are the null and alternative hypotheses for the hypothesis test? O A. Ho: P₁ = P₂ H₁: P₁ P2 O B. Ho: P₁ P₂ H₁: P₁ = P2 O E. Ho: P₁ SP₂ H₁: P₁ P2 OC. Ho: P₁ P2 H₁: P₁ P2 OF. Ho: P₁ H₁: P₁ P₂ P2arrow_forward
- Mitchell works in the produce section at a small local supermarket and would like to test whether the proportion of apples people purchase is the same for each season, using a significance level of 0.05. He analyzes the apple purchases each season for a year and records his findings in the following table. Season Spring Summer Fall Winter Total --------- --------- ------ ------ ------- # of apples purchased 896 934 934 971 3735 (a) In performing this statistical test, state the hypotheses. O Ho: the proportion of customers is the same each season vs. HA: the proportion of customers is not the same each season O Họ: the distribution of apples people purchased is not the same for each season vs. HẠ: the distribution of apples people purchased is the same for each season O Họ: the observed number of apples people purchased is the same for each season vs. Ha: the observed number of apples people purchased is not the same for each season O Họ; the distribution of apples people purchased is…arrow_forwardA study was conducted to determine the proportion of people who dream in black and white instead of color. Among 294 people over the age of 55, 63 dream in black and white, and among 300 people under the age of 25, 19 dream in black and white. Use a 0.05 significance level to test the claim that the proportion of people over 55 who dream in black and white is greater than the proportion for those under 25. Complete parts (a) through (c) below. a. Test the claim using a hypothesis test. Consider the first sample to be the sample of people over the age of 55 and the second sample to be the sample of people under the age of 25. What are the null and alternative hypotheses for the hypothesis test? A. Ho: P₁ = P2 H₁: P₁ P2 D. Ho: P₁ P2 H₁: P₁ P2 OB. Ho: P1 P2 H₁: P₁ P2 O E. Ho: P1 H₁: P₁ P2 P2 O C. Ho: P₁ P2 H₁: P₁ = P2 OF. Ho: P₁ P2 H₁: P₁ P2arrow_forwardThe results of a random sample of students by type of school and their attitudes on safety steps taken by the school staff are shown in the table below. At the 5% significance level, can you conclude that attitudes about safety steps taken by the school staff are related to the type of school? School staff has School Type Taken all steps for student safety Taken some steps for student safety Public 40 51 Private 64 34arrow_forward
arrow_back_ios
SEE MORE QUESTIONS
arrow_forward_ios
Recommended textbooks for you
- MATLAB: An Introduction with ApplicationsStatisticsISBN:9781119256830Author:Amos GilatPublisher:John Wiley & Sons Inc
 Probability and Statistics for Engineering and th...StatisticsISBN:9781305251809Author:Jay L. DevorePublisher:Cengage Learning
 Statistics for The Behavioral Sciences (MindTap C...StatisticsISBN:9781305504912Author:Frederick J Gravetter, Larry B. WallnauPublisher:Cengage Learning
  Elementary Statistics: Picturing the World (7th E...StatisticsISBN:9780134683416Author:Ron Larson, Betsy FarberPublisher:PEARSON
 The Basic Practice of StatisticsStatisticsISBN:9781319042578Author:David S. Moore, William I. Notz, Michael A. FlignerPublisher:W. H. Freeman
 Introduction to the Practice of StatisticsStatisticsISBN:9781319013387Author:David S. Moore, George P. McCabe, Bruce A. CraigPublisher:W. H. Freeman
MATLAB: An Introduction with Applications
Statistics
ISBN:9781119256830
Author:Amos Gilat
Publisher:John Wiley & Sons Inc
Probability and Statistics for Engineering and th...
Statistics
ISBN:9781305251809
Author:Jay L. Devore
Publisher:Cengage Learning
Statistics for The Behavioral Sciences (MindTap C...
Statistics
ISBN:9781305504912
Author:Frederick J Gravetter, Larry B. Wallnau
Publisher:Cengage Learning
Elementary Statistics: Picturing the World (7th E...
Statistics
ISBN:9780134683416
Author:Ron Larson, Betsy Farber
Publisher:PEARSON
The Basic Practice of Statistics
Statistics
ISBN:9781319042578
Author:David S. Moore, William I. Notz, Michael A. Fligner
Publisher:W. H. Freeman
Introduction to the Practice of Statistics
Statistics
ISBN:9781319013387
Author:David S. Moore, George P. McCabe, Bruce A. Craig
Publisher:W. H. Freeman