
Big Ideas Math A Bridge To Success Algebra 1: Student Edition 2015
1st Edition
ISBN: 9781680331141
Author: HOUGHTON MIFFLIN HARCOURT
Publisher: Houghton Mifflin Harcourt
expand_more
expand_more
format_list_bulleted
Related questions
Question
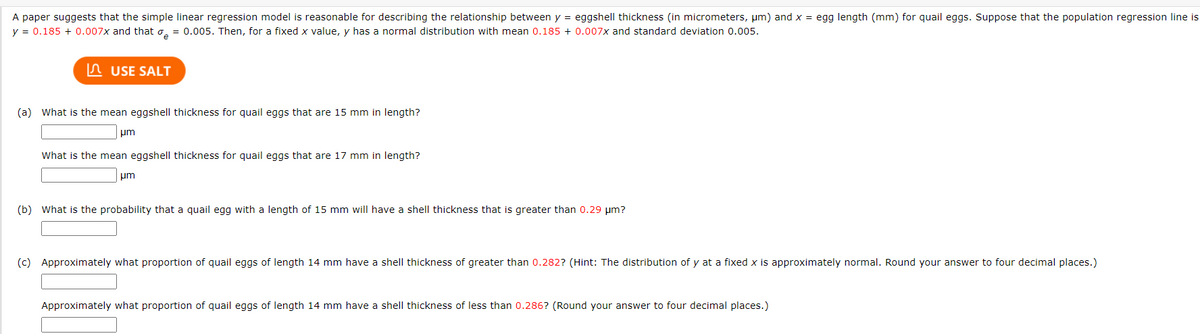

Transcribed Image Text:A paper suggests that the simple linear regression model is reasonable for describing the relationship between y = eggshell thickness (in micrometers, μm) and x = egg length (mm) for quail eggs. Suppose that the population regression line is
y = 0.185 +0.007x and that = 0.005. Then, for a fixed x value, y has a normal distribution with mean 0.185 +0.007x and standard deviation 0.005.
USE SALT
(a) What is the mean eggshell thickness for quail eggs that are 15 mm in length?
μm
What is the mean eggshell thickness for quail eggs that are 17 mm in length?
um
(b) What is the probability that a quail egg with a length of 15 mm will have a shell thickness that is greater than 0.29 um?
(c) Approximately what proportion of quail eggs of length 14 mm have a shell thickness of greater than 0.282? (Hint: The distribution of y at a fixed x is approximately normal. Round your answer to four decimal places.)
Approximately what proportion of quail eggs of length 14 mm have a shell thickness of less than 0.286? (Round your answer to four decimal places.)
Expert Solution
This question has been solved!
Explore an expertly crafted, step-by-step solution for a thorough understanding of key concepts.

This is a popular solution

Trending nowThis is a popular solution!

Step by stepSolved in 2 steps with 1 images

Knowledge Booster

Similar questions
- What does the y -intercept on the graph of a logistic equation correspond to for a population modeled by that equation?arrow_forwardOlympic Pole Vault The graph in Figure 7 indicates that in recent years the winning Olympic men’s pole vault height has fallen below the value predicted by the regression line in Example 2. This might have occurred because when the pole vault was a new event there was much room for improvement in vaulters’ performances, whereas now even the best training can produce only incremental advances. Let’s see whether concentrating on more recent results gives a better predictor of future records. (a) Use the data in Table 2 (page 176) to complete the table of winning pole vault heights shown in the margin. (Note that we are using x=0 to correspond to the year 1972, where this restricted data set begins.) (b) Find the regression line for the data in part ‚(a). (c) Plot the data and the regression line on the same axes. Does the regression line seem to provide a good model for the data? (d) What does the regression line predict as the winning pole vault height for the 2012 Olympics? Compare this predicted value to the actual 2012 winning height of 5.97 m, as described on page 177. Has this new regression line provided a better prediction than the line in Example 2?arrow_forwardConsider a linear regression model for the decrease in blood pressure (mmHg) over a four-week period with muy=2.8+0.8x and standard deviation chi=3.2. The explanatory variable x is the number of servings fruits and vegetables in a calorie-controlled diet. The decrease in blood pressure y will vary about this subpopulation mean. What is the distribution of y for this subpopulation?arrow_forward
- Consider a linear regression model for the decrease in blood pressure (mmHg) over a four-week period with muy=2.8+0.8x and standard deviation chi=3.2. The explanatory variable x is the number of servings fruits and vegetables in a calorie-controlled diet. What is the slope of the population regression line?arrow_forwardConsider a linear regression model for the decrease in blood pressure (mmHg) over a four-week period with muy=2.8+0.8x and standard deviation chi=3.2. The explanatory variable x is the number of servings fruits and vegetables in a calorie-controlled diet. What is the subpopulation mean when x = 7 servings per day?arrow_forwardConsider a linear regression model for the decrease in blood pressure (mmHg) over a four-week period with muy=2.8+0.8x and standard deviation chi=3.2. The explanatory variable x is the number of servings fruits and vegetables in a calorie-controlled diet. Explain clearly what this slope says about the change in the mean of y for a change in x.arrow_forward
- A pumpkin farmer wants to create a linear regression model to predict the circumference of a pumpkin (Y-variable) from its weight (X-variable). He samples 40 pumpkins from his pumpkin patch and the mean weight is 14 lbs with a standard deviation of 1 lb. The mean circumference is 50 inches with a standard deviation of 10 inches. The correlation between pumpkin weight and circumference is r = 0.50. What is the slope of the linear regression model predicting circumference from weight? 7 1 5 3arrow_forwardConsider a certain data set on shoulder girth and height of a group of individuals. The mean shoulder girth is 107.20 cm with a standard deviation of 10.37 cm. The mean height is 171.14 cm with a standard deviation of 9.41 cm. The correlation between height and shoulder girth is 0.67. Write the equation of the regression line for predicting height.arrow_forward4b) The data shows a systolic and a diastolic blood pressure of certain patients. Find the linear regression equation, using the first variable x (systolic) as the independent variable. Find the best predicted diastolic blood pressure for a patient with a systolic blood pressure (y) reading of 140. What is the correlation coefficient, r? Using a significance level of a = 0.05, is there a significant linear relationship between systolic and diastolic blood pressure? Blood Pressure: Systolic Diastolic 112 125 115 136 143 116 123 124 elimii 70 89 65 90 97 64 SUTT nisinoo aqdM 21.SS bns aqdM 78 ahoqnis erit te zbesqz steb ils to 69 bns ago 20.EI to adimil srit terit sonabilnos 2 nistnoo aqdM 21.SS bnc agdM sgsavs arit ferli mislo a hoqnis orti roqque lovedni sonsbilnos 3028 wolsd insmsisiz tomo artezorio SeqdM 2.55 al 2.SS to sulavadi znistmoodi ezusaed mish ads toqque ton zaob 2.55 to sulsy sdt anistroo ti sausosd mislo ert hoqquz 200b to sulav orit nisinoo ton zoob 11 saussed misbb adi…arrow_forward
- A researcher has developed a regression model from fourteen pairs of data points. He wants to test to determine if the slope is significantly different from zero. He uses a two-tailed test and a = 0.01. The critical tablet value is 2.718 3.012 2.650 O 3.055 O 2.168arrow_forwardAn amusement park owner wants to create a linear regression model to predict the number of ice cream cones sold (Y-variable) based on the day's attendance (X-variable). From his collected data he finds the mean number of ice cream cone sales to be 1,200 cones with a standard deviation of 180. The mean daily attendance is 2,000 people, with a standard deviation of 200. The correlation between ice cream cone sales and attendance is r = 0.65. What is the intercept of the linear regression model predicting ice cream cone sales from daily attendance? 200 80 130 30arrow_forwardFor the population of Jellystone bears, the mean weight is 600 pounds and the mean blood pressure is 150, and the SLR regression slope for predicting blood pressure using weight has been found to be 0.3. Let us accept that a live bear cannot have negative blood pressure. What is the minimum weight in pounds for live bears in Jellystone Park?arrow_forward
arrow_back_ios
SEE MORE QUESTIONS
arrow_forward_ios
Recommended textbooks for you
- Big Ideas Math A Bridge To Success Algebra 1: Stu...AlgebraISBN:9781680331141Author:HOUGHTON MIFFLIN HARCOURTPublisher:Houghton Mifflin Harcourt

 Glencoe Algebra 1, Student Edition, 9780079039897...AlgebraISBN:9780079039897Author:CarterPublisher:McGraw Hill
  College AlgebraAlgebraISBN:9781305115545Author:James Stewart, Lothar Redlin, Saleem WatsonPublisher:Cengage Learning
 Functions and Change: A Modeling Approach to Coll...AlgebraISBN:9781337111348Author:Bruce Crauder, Benny Evans, Alan NoellPublisher:Cengage Learning
Big Ideas Math A Bridge To Success Algebra 1: Stu...
Algebra
ISBN:9781680331141
Author:HOUGHTON MIFFLIN HARCOURT
Publisher:Houghton Mifflin Harcourt
Glencoe Algebra 1, Student Edition, 9780079039897...
Algebra
ISBN:9780079039897
Author:Carter
Publisher:McGraw Hill
College Algebra
Algebra
ISBN:9781305115545
Author:James Stewart, Lothar Redlin, Saleem Watson
Publisher:Cengage Learning
Functions and Change: A Modeling Approach to Coll...
Algebra
ISBN:9781337111348
Author:Bruce Crauder, Benny Evans, Alan Noell
Publisher:Cengage Learning