
MATLAB: An Introduction with Applications
6th Edition
ISBN: 9781119256830
Author: Amos Gilat
Publisher: John Wiley & Sons Inc
expand_more
expand_more
format_list_bulleted
Related questions
Concept explainers
Question
thumb_up100%
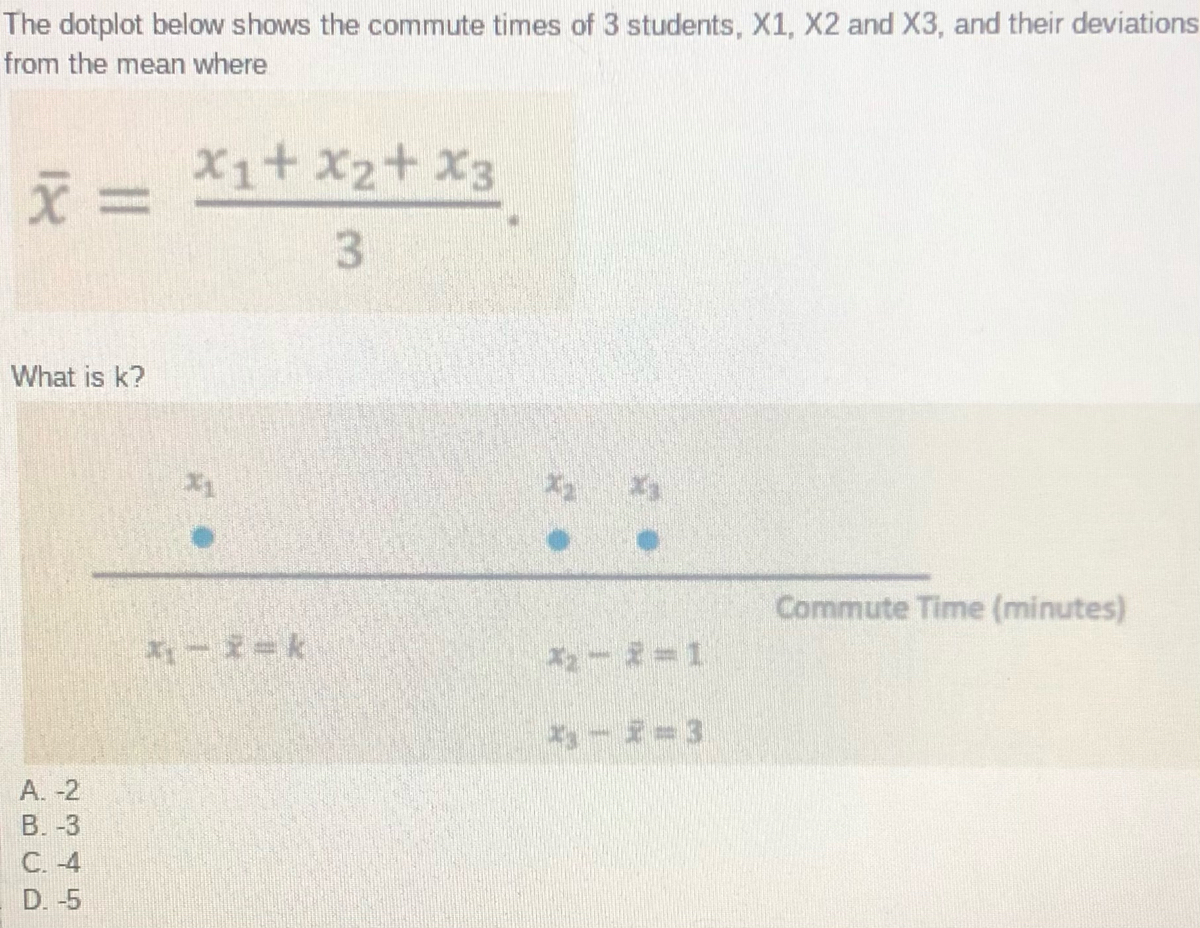

Transcribed Image Text:The dotplot below shows the commute times of 3 students, X1, X2 and X3, and their deviations
from the mean where
X1+ x2+ X3
3.
What is k?
Commute Time (minutes)
ー=k
ねー2=1
A. -2
B. -3
C. -4
D. -5
Expert Solution
arrow_forward
Step 1
Given ,

Step by stepSolved in 2 steps with 1 images

Knowledge Booster


Learn more about
Need a deep-dive on the concept behind this application? Look no further. Learn more about this topic, statistics and related others by exploring similar questions and additional content below.Similar questions
- Can you Differentiate the functionarrow_forwardExpress the total revenue R as a function of the price p per item when q = -5p + 1200 OR = -5p? + 1200 OR = 5p? – 1200p - O R= -5p + 1200 OR= -5p? + 1200parrow_forwardWhich function is equivalent to y = 3(x+4)² + 5? Oy = 3x2 + 24x + 63 Oy = 3x? + 21 O y = 3x2 + 24x + 53 Oy = 3x? + 8x + 21arrow_forward
- A batsman played with an average of 78 runs per match in first 28 matches. In the next 14 matches, he scored runs win an average of "x" runs per match so that his overall average becomes 80 runs per match. Find the value of “x”.arrow_forwardFind $ such that D =F. x - hg - hp-arrow_forwardUse the function rule y=x2y=x2 to determine how many 1-foot tiles will need to be used to cover a 10-foot by 10-foot room.arrow_forward
arrow_back_ios
arrow_forward_ios
Recommended textbooks for you
- MATLAB: An Introduction with ApplicationsStatisticsISBN:9781119256830Author:Amos GilatPublisher:John Wiley & Sons Inc
 Probability and Statistics for Engineering and th...StatisticsISBN:9781305251809Author:Jay L. DevorePublisher:Cengage Learning
 Statistics for The Behavioral Sciences (MindTap C...StatisticsISBN:9781305504912Author:Frederick J Gravetter, Larry B. WallnauPublisher:Cengage Learning
  Elementary Statistics: Picturing the World (7th E...StatisticsISBN:9780134683416Author:Ron Larson, Betsy FarberPublisher:PEARSON
 The Basic Practice of StatisticsStatisticsISBN:9781319042578Author:David S. Moore, William I. Notz, Michael A. FlignerPublisher:W. H. Freeman
 Introduction to the Practice of StatisticsStatisticsISBN:9781319013387Author:David S. Moore, George P. McCabe, Bruce A. CraigPublisher:W. H. Freeman
MATLAB: An Introduction with Applications
Statistics
ISBN:9781119256830
Author:Amos Gilat
Publisher:John Wiley & Sons Inc
Probability and Statistics for Engineering and th...
Statistics
ISBN:9781305251809
Author:Jay L. Devore
Publisher:Cengage Learning
Statistics for The Behavioral Sciences (MindTap C...
Statistics
ISBN:9781305504912
Author:Frederick J Gravetter, Larry B. Wallnau
Publisher:Cengage Learning
Elementary Statistics: Picturing the World (7th E...
Statistics
ISBN:9780134683416
Author:Ron Larson, Betsy Farber
Publisher:PEARSON
The Basic Practice of Statistics
Statistics
ISBN:9781319042578
Author:David S. Moore, William I. Notz, Michael A. Fligner
Publisher:W. H. Freeman
Introduction to the Practice of Statistics
Statistics
ISBN:9781319013387
Author:David S. Moore, George P. McCabe, Bruce A. Craig
Publisher:W. H. Freeman