
ENGR.ECONOMIC ANALYSIS
14th Edition
ISBN: 9780190931919
Author: NEWNAN
Publisher: Oxford University Press
expand_more
expand_more
format_list_bulleted
Related questions
Question
The bolded wording is the answer choices for the drop-down arrows it has 4 answer choices
Euphoria's
of corn, and Arcadia's opportunity cost of producing 1 pair of jeans is a) 1/2 b) 1/4 c) 2 d) 4 of corn.
Therefore, a) Euphoria b) Arcadia has a
Euphoria
Trade Actions (Jeans) a) Exports 14 b) Imports 14
Trade Actions (Corn) a) Exports 42 b) Imports 42
Arcadia
Trade Actions (Jeans) a) Exports 14 b) Imports 14
Trade Actions (Corn) a) Exports 42 b) Imports 42
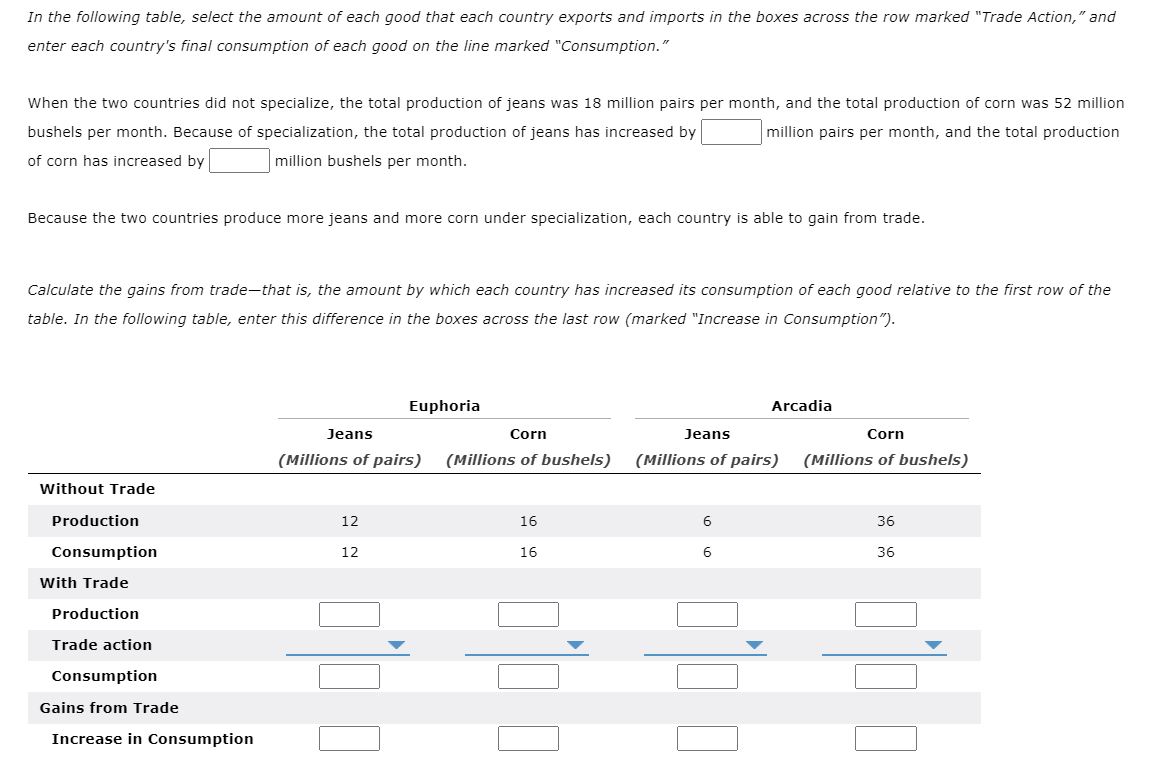

Transcribed Image Text:In the following table, select the amount of each good that each country exports and imports in the boxes across the row marked "Trade Action," and
enter each country's final consumption of each good on the line marked "Consumption."
When the two countries did not specialize, the total production of jeans was 18 million pairs per month, and the total production of corn was 52 million
bushels per month. Because of specialization, the total production of jeans has increased by
million pairs per month, and the total production
of corn has increased by
million bushels per month.
Because the two countries produce more jeans and more corn under specialization, each country is able to gain from trade.
Calculate the gains from trade-that is, the amount by which each country has increased its consumption of each good relative to the first row of the
table. In the following table, enter this difference in the boxes across the last row (marked "Increase in Consumption").
Euphoria
Arcadia
Jeans
Corn
Jeans
Corn
(Millions of pairs)
(Millions of bushels)
(Millions of pairs)
(Millions of bushels)
Without Trade
Production
12
16
36
Consumption
12
16
6
36
With Trade
Production
Trade action
Consumption
Gains from Trade
Increase in Consumption

Transcribed Image Text:Consider two neighboring island countries called Euphoria and Arcadia. They each have 4 million labor hours available per month that they can use to
produce jeans, corn, or a combination of both. The following table shows the amount of jeans or corn that can be produced using 1 hour of labor.
Jeans
Corn
Country
(Pairs per hour of labor)
(Bushels per hour of labor)
Euphoria
4
16
Arcadia
6
12
Initially, suppose Arcadia uses 1 million hours of labor per month to produce jeans and 3 million hours per month to produce corn, while Euphoria uses
3 million hours of labor per month to produce jeans and 1 million hours per month to produce corn. Consequently, Euphoria produces 12 million pairs
of jeans and 16 million bushels of corn, and Arcadia produces 6 million pairs of jeans and 36 million bushels of corn. Assume there are no other
countries willing to trade goods, so, in the absence of trade between these two countries, each country consumes the amount of jeans and corn it
produces.
Euphoria's opportunity cost of producing 1 pair of jeans is
of corn, and Arcadia's opportunity cost of producing 1 pair of jeans is
v of corn. Therefore,
has a comparative advantage in the production of jeans, and
has a comparative
advantage in the production of corn.
Suppose that each country completely specializes in the production of the good in which it has a comparative advantage, producing only that good. In
this case, the country that produces jeans will produce
million pairs per month, and the country that produces corn will produce
million bushels per month.
In the following table, enter each country's production decision on the third row of the table (marked "Production").
Suppose the country that produces jeans trades 14 million pairs of jeans to the other country in exchange for 42 million bushels of corn.
Expert Solution
This question has been solved!
Explore an expertly crafted, step-by-step solution for a thorough understanding of key concepts.

This is a popular solution

Trending nowThis is a popular solution!

Step by stepSolved in 4 steps

Knowledge Booster


Learn more about
Need a deep-dive on the concept behind this application? Look no further. Learn more about this topic, economics and related others by exploring similar questions and additional content below.Similar questions
- Question 1A. Define and explain the theory of comparative advantage (use an example ifnecessary).B. Discuss limitations of comparative advantage (Include in your answer at leastfive key limitations to this theory).C. Spencer Grant is a New York-based investor. He has been closely following hisinvestment in 100 shares of Vaniteux, a French firm that went public in Februaryof 2010. When he purchased his 100 shares at €17.25 per share, the euro wastrading at $1.360/€. Currently, the share is trading at €28.33 per share, and thedollar has fallen to $1.4170/€.a If Spencer sells his shares today, what percentage change in the share pricewould he receive?What is the percentage change in the value of euro versus the dollar overthis same period?What would be the total return Spencer would earn on his shares if he soldthem at these rates?arrow_forwardA) What is Maria’s opportunity cost to obtain 20 cartons of Blueberries (Use Figure 3 above)? B) What is Maria’s opportunity cost for 10 cartons of Strawberries (Use Figure 3 above)? C) What is Maria’s opportunity cost for 1 carton of Strawberries (Use Figure 3 above)? Hint: Review Problems 10-19 (Session 1 Practice Problems)arrow_forwardBeer 10 0 10 20 30 Pizza West Lothian Beer 20 1319 10 0 10 20 30 Pizza East Lothian In the accompanying diagrams, solid lines are production possibilities curves, and the dashed lines are trading possibilities curves. The data contained in the production possibilities curves are based on the assumption ofarrow_forward
- Include correctly labeled diagrams, if useful or required, in explaining your answers. A correctly labeled diagram must have all axes and curves clearly labeled and must show directional changes. If the question prompts you to “Calculate,” you must show how you arrived at your final answer. Assume that sugar-based soft drinks are produced in a market shown on the graph above. Answer the following questions based on the information given in the graph. (a) To reduce the consumption of sugary soft drinks, suppose the government imposes a $2 per-unit sales tax on soft drinks. (i) Will the price of soft drinks increase by the full amount of the sales tax? Explain. (ii) Calculate the tax revenue the government can collect from the sale of soft drinks. Show your work. (iii) Will the consumer surplus increase, decrease, or stay the same after the tax? (iv) Calculate the deadweight loss created by the tax. Show your work. (b) Suppose that instead of imposing the per-unit sales tax,…arrow_forwardMy dear hero expert bro and pro Hand written solution is not allowed.arrow_forward25. Assuming labor is the only resource and England has 60 man-hours (mhrs) and Portugal 180 mhrs of labor resource available for production, which country has the comparative advantage in wine? a) Portugal b) England c) Both d) Neither e) Cannot tellarrow_forward
- Small engines are the main components of office and house appliances like printers, hand dryers, microwave ovens, food processors, etc. The graph depicts the market for small engines in the United States. Suppose that the government imposes a $15 tariff on each imported engine in an effort to bring manufacturing jobs back to the United States. Place the Waste shape to describe the waste of resources that would result from the trade restriction. Price (3) Incorrect 50 45 40 35 30 25 20 15 10 5 0 0 total cost: What is the total cost of the tariff? 337.5 Domestic supply Domestic demand 15 30 45 60 75 90 105 120 135 150 Quantity (millions of engines) Incorrect World supply Waste millions of dollarsarrow_forwardI only need help in the 3 last questions Q1. The following table shows the output of rice and machinery one labor hour can produce in Mexico and Thailand: Rice Machinery Thailand 6 2 Mexico 2 1 What are the marginal products of labor in rice and machinery production in Thailand? What about Mexico? Which country has an absolute advantage in rice and which country has an absolute advantage in machinery? What is the autarkic price ratio of machinery relative to rice in each country? Which country has a comparative advantage in rice and which country has a comparative advantage in machinery? Suppose Mexico has 1,000 labor hours available. Construct the production-possibility frontier (PPF) and identify the optimal autarky equilibrium (using an indifference curve) for Mexico. Suppose the international price is set at 1 machinery:2.5 rice and Mexico decides to completely specialize in producing the product in which it has a comparative advantage. How would…arrow_forwardConsider the following scenario to understand the relationship between marginal and average values. Suppose Sam is a professional basketball player, and his game log for free throws can be summarized in the following table. Fill in the columns with Sam's free-throw percentage for each game and his overall free-throw average after each game. Game Result Total Game Free-Throw Percentage Average Free-Throw Percentage Game 1 8/10 80 12/20 14/28 16/32 22/40 2 3 4 5 8/10 4/10 2/8 2/4 6/8 80 On the following graph, use the orange points (square symbol) to plot Sam's free-throw percentage for each game individually, and use the green points (triangle symbol) to plot his overall average free-throw percentage after each game. Note: Plot your points in the order in which you would like them connected. Line segments will connect the points automatically.arrow_forward
- QUESTION 2 After receiving an impressive commendation following a project, Ash realised the key to her inspiration and success was eating goji berries before starting her work. Ash can buy any number of kilograms of berries for $20 per kilogram. Ash gains a total benefit of $50 from consuming 2 kilograms of berries, and a total benefit of $65 from consuming 3 kilograms of berries. Which of the following statement(s) are true: There is insufficient information to determine the marginal cost of the third kilogram of berries. The average benefit of consuming the third kilogram of berries is $15. Ash should buy the third kilogram of berries because the marginal cost is less than the marginal benefit. The marginal benefit of consuming the third kilogram of berries is $15.arrow_forwardMultiple choice question. As opposed to general equilibrium analysis, partial equilibrium analysis looksa) at an equilibrium and changes to it in a single, isolated market.b) at how changes in all other markets effect a particular market.c) at how equilibrium is determined in all markets simultaneously.d) at either price or quantity movements.arrow_forward
arrow_back_ios
arrow_forward_ios
Recommended textbooks for you
 Principles of Economics (12th Edition)EconomicsISBN:9780134078779Author:Karl E. Case, Ray C. Fair, Sharon E. OsterPublisher:PEARSON
 Engineering Economy (17th Edition)EconomicsISBN:9780134870069Author:William G. Sullivan, Elin M. Wicks, C. Patrick KoellingPublisher:PEARSON
 Principles of Economics (MindTap Course List)EconomicsISBN:9781305585126Author:N. Gregory MankiwPublisher:Cengage Learning
 Managerial Economics: A Problem Solving ApproachEconomicsISBN:9781337106665Author:Luke M. Froeb, Brian T. McCann, Michael R. Ward, Mike ShorPublisher:Cengage Learning
 Managerial Economics & Business Strategy (Mcgraw-...EconomicsISBN:9781259290619Author:Michael Baye, Jeff PrincePublisher:McGraw-Hill Education
Principles of Economics (12th Edition)
Economics
ISBN:9780134078779
Author:Karl E. Case, Ray C. Fair, Sharon E. Oster
Publisher:PEARSON
Engineering Economy (17th Edition)
Economics
ISBN:9780134870069
Author:William G. Sullivan, Elin M. Wicks, C. Patrick Koelling
Publisher:PEARSON
Principles of Economics (MindTap Course List)
Economics
ISBN:9781305585126
Author:N. Gregory Mankiw
Publisher:Cengage Learning
Managerial Economics: A Problem Solving Approach
Economics
ISBN:9781337106665
Author:Luke M. Froeb, Brian T. McCann, Michael R. Ward, Mike Shor
Publisher:Cengage Learning
Managerial Economics & Business Strategy (Mcgraw-...
Economics
ISBN:9781259290619
Author:Michael Baye, Jeff Prince
Publisher:McGraw-Hill Education