
MATLAB: An Introduction with Applications
6th Edition
ISBN: 9781119256830
Author: Amos Gilat
Publisher: John Wiley & Sons Inc
expand_more
expand_more
format_list_bulleted
Related questions
Question
thumb_up100%
Statistics
Need help with #1 Does the normality assumption appear to be reasonable and why?
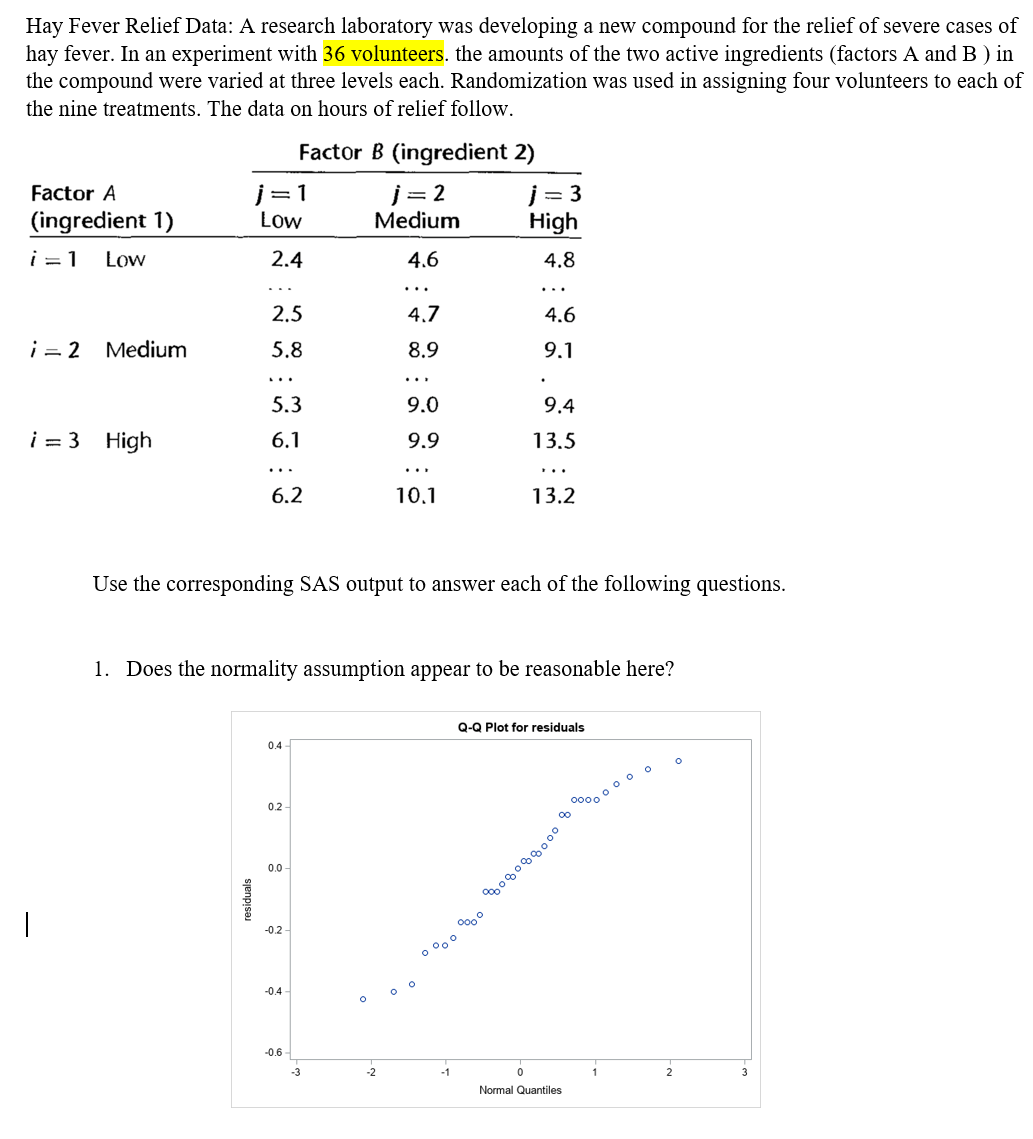

Transcribed Image Text:Hay Fever Relief Data: A research laboratory was developing a new compound for the relief of severe cases of
hay fever. In an experiment with 36 volunteers. the amounts of the two active ingredients (factors A and B ) in
the compound were varied at three levels each. Randomization was used in assigning four volunteers to each of
the nine treatments. The data on hours of relief follow.
Factor B (ingredient 2)
j=1
Low
j = 2
Medium
Factor A
j= 3
(ingredient 1)
High
i = 1
Low
2.4
4.6
4,8
...
...
2.5
4.7
4.6
i = 2
Medium
5.8
8.9
9.1
...
...
5.3
9.0
9.4
i = 3 High
6.1
9.9
13.5
...
...
...
6.2
10.1
13.2
Use the corresponding SAS output to answer each of the following questions.
1. Does the normality assumption appear to be reasonable here?
Q-Q Plot for residuals
0.4
0.2
0.0
|
-0.2
o 000
-0.4
-0.6
-2
-1
2
3
Normal Quantiles
sjenpisa
Expert Solution
arrow_forward
Step 1
Given information:
The Q-Q graph for residuals is given.

Trending nowThis is a popular solution!

Step by stepSolved in 2 steps

Knowledge Booster

Similar questions
- Which of the following will help to mitigate confounding? (Choose all correct answers) multiple regression analysis randomization stratification A and B None of the abovearrow_forwardQuestion: How and why is training and testing data used for any model also describe any correlation you observe between the response and predictor variables.arrow_forwardTrue or False: Correlation implies causation O False O Truearrow_forward
- Please help it’s not gradedarrow_forwardHelp me pleasearrow_forwardFully explain the issues and problems with the below correlational data. Focus on the data in the highlighted box versus the rest of the data. Do not try to explain the data, but rather focus on the statistical issues and problems. IF YOU CAN'T SEE THE IMAGE HERE. PLEASE GO TO THIS LINK Linke 10 6. 8. 7. 5. 4. 10 20 30 40 50 60 70 80 90 100 Age Enjoyment of Hip-Hoparrow_forward
- Correlation Testing: What is the range of values for this test statistic? Everyday Application of correlation testing? Why is correlation testing significant in the real world? How does it relate to engineering?arrow_forwardI will give a great review/rating! Thank you (:arrow_forwardplease answer the question and show work!! thank you also please make sure if writing on paper handwriting can be read thank you again :)arrow_forward
arrow_back_ios
arrow_forward_ios
Recommended textbooks for you
- MATLAB: An Introduction with ApplicationsStatisticsISBN:9781119256830Author:Amos GilatPublisher:John Wiley & Sons Inc
 Probability and Statistics for Engineering and th...StatisticsISBN:9781305251809Author:Jay L. DevorePublisher:Cengage Learning
 Statistics for The Behavioral Sciences (MindTap C...StatisticsISBN:9781305504912Author:Frederick J Gravetter, Larry B. WallnauPublisher:Cengage Learning
  Elementary Statistics: Picturing the World (7th E...StatisticsISBN:9780134683416Author:Ron Larson, Betsy FarberPublisher:PEARSON
 The Basic Practice of StatisticsStatisticsISBN:9781319042578Author:David S. Moore, William I. Notz, Michael A. FlignerPublisher:W. H. Freeman
 Introduction to the Practice of StatisticsStatisticsISBN:9781319013387Author:David S. Moore, George P. McCabe, Bruce A. CraigPublisher:W. H. Freeman
MATLAB: An Introduction with Applications
Statistics
ISBN:9781119256830
Author:Amos Gilat
Publisher:John Wiley & Sons Inc
Probability and Statistics for Engineering and th...
Statistics
ISBN:9781305251809
Author:Jay L. Devore
Publisher:Cengage Learning
Statistics for The Behavioral Sciences (MindTap C...
Statistics
ISBN:9781305504912
Author:Frederick J Gravetter, Larry B. Wallnau
Publisher:Cengage Learning
Elementary Statistics: Picturing the World (7th E...
Statistics
ISBN:9780134683416
Author:Ron Larson, Betsy Farber
Publisher:PEARSON
The Basic Practice of Statistics
Statistics
ISBN:9781319042578
Author:David S. Moore, William I. Notz, Michael A. Fligner
Publisher:W. H. Freeman
Introduction to the Practice of Statistics
Statistics
ISBN:9781319013387
Author:David S. Moore, George P. McCabe, Bruce A. Craig
Publisher:W. H. Freeman