MATLAB: An Introduction with Applications
6th Edition
ISBN: 9781119256830
Author: Amos Gilat
Publisher: John Wiley & Sons Inc
expand_more
expand_more
format_list_bulleted
Question

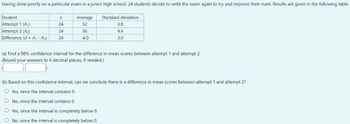
Transcribed Image Text:Having done poorly on a particular exam in a junior high school, 24 students decide to write the exam again to try and improve their mark. Results are given in the following table.
Student
Attempt 1 (A₁)
Attempt 2 (A₂)
Difference (d = A₁ - A₂)
n
24
24
24
Average
52
56
-4.0
Standard deviation
3.8
4.4
3.0
(a) Find a 98% confidence interval for the difference in mean scores between attempt 1 and attempt 2.
(Round your answers to 4 decimal places, if needed.)
(b) Based on this confidence interval, can we conclude there is a difference in mean scores between attempt 1 and attempt 2?
O Yes, since the interval contains 0.
No, since the interval contains 0.
O Yes, since the interval is completely below 0.
O No, since the interval is completely below 0.
Expert Solution
This question has been solved!
Explore an expertly crafted, step-by-step solution for a thorough understanding of key concepts.
Step by stepSolved in 4 steps with 1 images

Knowledge Booster
Similar questions
- A researcher is interested in studying the use of hypnosis to relieve pain. She took a random sample of 16 subjects and measured their sensory ratings. The mean of the sensory ratings was found to be 7.5 and standard deviation to be 2.3. It is known that the sensory ratings are normally distributed. Construct a 99% confidence interval for the mean sensory ratings of the population. a) (5.81, 9.19) b) (6.27, 8.73) c) (6.36, 8.64) d) (6.02, 8.98)arrow_forwardA sample of n = 18 data values randomly selected from a normally distributed population has variance s = 24.8. Construct a 95% confidence interval for the population variance. Round your endpoints to one decimal place. < o? <arrow_forwardSuppose you sample six people on their number of visits to Chick-fil-A in a month given by variable Y. Y = 3,6,7,10,15,19 (A) What is the mean of Y? Standard Deviation of Y?(B) What is the Standard Error of Y?(C) Construct 90% and 95% Confidence Intervals for Y.arrow_forward
- 2 different treatments were used to speed the relief time (in minutes) of migraines. 8 subjects received each treatment. The recovery times are listed below. Treatment 1: 20 19 29 25 34 32 39 38 Treatment 2: 18 18 16 17 29 28 21 37 Construct a 90% confidence interval for the difference in the relief time between the 2 treatments.arrow_forwardQuestion:arrow_forwardA. True or False? A researcher compares the BMI of two populations of individuals from different socioeconomic backgrounds and finds that the proportion of individuals considered obese and from a poor background is .37 (n = 112), and the proportion of individuals considered obese and from an affluent background is .27 (n = 87); a 95% confidence interval for the risk difference for obesity among members of the poor population compared to the affluent population is (-0.03, 0.23). B. Why is it true or false?arrow_forward
- Suppose the mean height in inches of all 9th grade students at one high school is estimated. The population standard deviation is 4 inches. The heights of 9 randomly selected students are 72, 61, 65, 64, 61, 67, 71, 63 and 72. x¯ =? Margin of error at 90% confidence level =? 90% confidence interval = [__.__ , __.__]arrow_forwardUsing traditional methods it takes 107 hours to receive an advanced flying license. A new training technique using Computer Aided Instruction (CAI) has been proposed. A researcher used the technique on 150 students and observed that they had a mean of 106 hours. Assume the population standard deviation is known to be 5 . Is there evidence at the 0.01 level that the technique performs differently than the traditional method? Step 1 of 6 : State the null and alternative hypotheses.arrow_forward
arrow_back_ios
arrow_forward_ios
Recommended textbooks for you
 MATLAB: An Introduction with ApplicationsStatisticsISBN:9781119256830Author:Amos GilatPublisher:John Wiley & Sons Inc
 Probability and Statistics for Engineering and th...StatisticsISBN:9781305251809Author:Jay L. DevorePublisher:Cengage Learning
 Statistics for The Behavioral Sciences (MindTap C...StatisticsISBN:9781305504912Author:Frederick J Gravetter, Larry B. WallnauPublisher:Cengage Learning
 Elementary Statistics: Picturing the World (7th E...StatisticsISBN:9780134683416Author:Ron Larson, Betsy FarberPublisher:PEARSON
 The Basic Practice of StatisticsStatisticsISBN:9781319042578Author:David S. Moore, William I. Notz, Michael A. FlignerPublisher:W. H. Freeman
 Introduction to the Practice of StatisticsStatisticsISBN:9781319013387Author:David S. Moore, George P. McCabe, Bruce A. CraigPublisher:W. H. Freeman

MATLAB: An Introduction with Applications
Statistics
ISBN:9781119256830
Author:Amos Gilat
Publisher:John Wiley & Sons Inc

Probability and Statistics for Engineering and th...
Statistics
ISBN:9781305251809
Author:Jay L. Devore
Publisher:Cengage Learning

Statistics for The Behavioral Sciences (MindTap C...
Statistics
ISBN:9781305504912
Author:Frederick J Gravetter, Larry B. Wallnau
Publisher:Cengage Learning

Elementary Statistics: Picturing the World (7th E...
Statistics
ISBN:9780134683416
Author:Ron Larson, Betsy Farber
Publisher:PEARSON

The Basic Practice of Statistics
Statistics
ISBN:9781319042578
Author:David S. Moore, William I. Notz, Michael A. Fligner
Publisher:W. H. Freeman

Introduction to the Practice of Statistics
Statistics
ISBN:9781319013387
Author:David S. Moore, George P. McCabe, Bruce A. Craig
Publisher:W. H. Freeman