
MATLAB: An Introduction with Applications
6th Edition
ISBN: 9781119256830
Author: Amos Gilat
Publisher: John Wiley & Sons Inc
expand_more
expand_more
format_list_bulleted
Related questions
Question
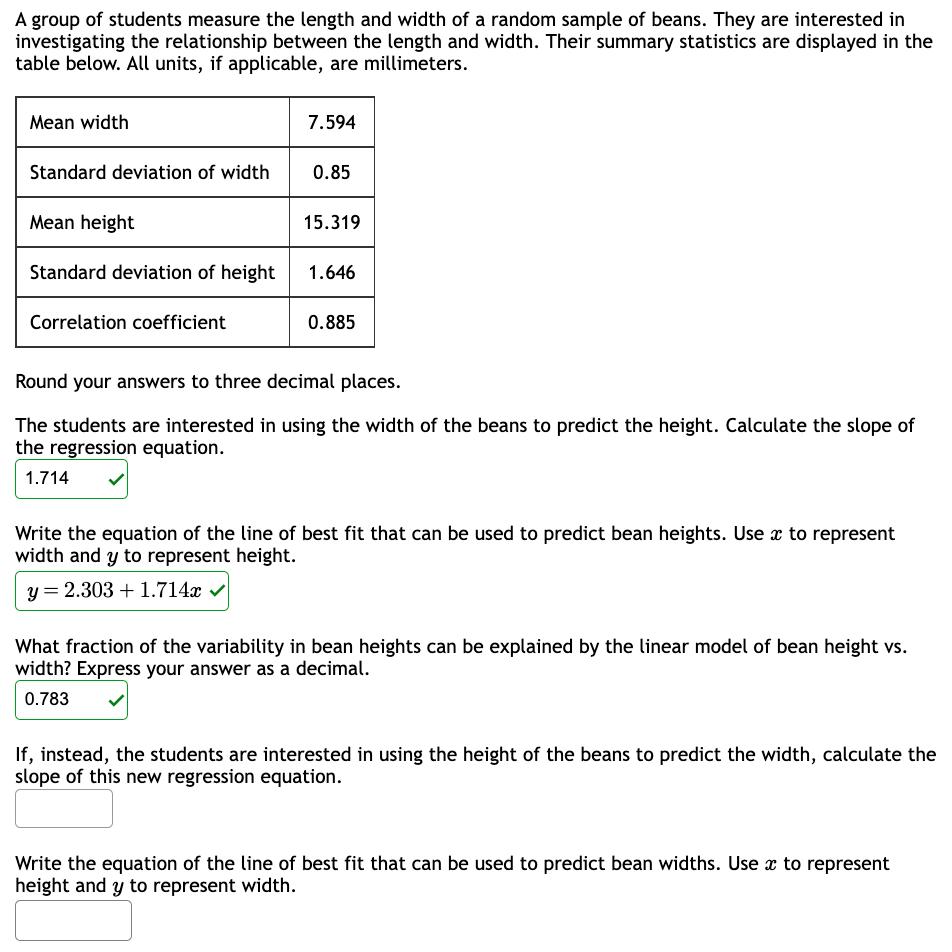

Transcribed Image Text:A group of students measure the length and width of a random sample of beans. They are interested in
investigating the relationship between the length and width. Their summary statistics are displayed in the
table below. All units, if applicable, are millimeters.
Mean width
Standard deviation of width
Mean height
Standard deviation of height
Correlation coefficient
7.594
0.85
15.319
1.646
0.885
Round your answers to three decimal places.
The students are interested in using the width of the beans to predict the height. Calculate the slope of
the regression equation.
1.714
Write the equation of the line of best fit that can be used to predict bean heights. Use x to represent
width and y to represent height.
y = 2.303 +1.714x ✓
What fraction of the variability in bean heights can be explained by the linear model of bean height vs.
width? Express your answer as a decimal.
0.783
If, instead, the students are interested in using the height of the beans to predict the width, calculate the
slope of this new regression equation.
Write the equation of the line of best fit that can be used to predict bean widths. Use x to represent
height and y to represent width.
Expert Solution
This question has been solved!
Explore an expertly crafted, step-by-step solution for a thorough understanding of key concepts.

This is a popular solution

Trending nowThis is a popular solution!

Step by stepSolved in 2 steps with 2 images

Knowledge Booster

Similar questions
- Please help me understand how to do this because I am lostarrow_forwardPlease work this problem for me. Thank youarrow_forwardNISH Boom Cardsl - Play boom.combg.com/play/1Dwb@fgH9jdMjFmxn/?Lenchcrld AYANWBBrodXKJA its X + 000000000000000000000 13 boomcardsk Use the following regression equation to predict the height of an 8-year-old American girl. Round all answers to the nearest hundredth (2 places after the decimal) and type it in the space below. y = 2.59x + 29.31 An average 8-year-old American girl is approximately 5 centimeters tall. W y tip Type here 90 C Submit X Give up Skip Q Overview ★ Save Card O P Dec 3 1arrow_forward
- An experiment is run. The mass of an object is recorded over time. Time (min) Mass (g) 32 40 36 32 37 32 39 30 50 27 Using your calculator, run a linear regression to determine the equation of the line of best fit. Round to two decimal places, use x for the variable.y=Using your equation, estimate the mass of the object at 41 minutes.grams=arrow_forwardThe arm span and foot length were both measured (in centimeters) for each of 20 students in a biology class. The computer output displays the regression analysis. Which of the following is the best interpretation of the coefficient of determination r2? About 37% of the variation in arm span is accounted for by the linear relationship formed with the foot length. About 65% of the variation in foot length is accounted for by the linear relationship formed with the arm span. About 63% of the variation in arm span is accounted for by the linear relationship formed with the foot length. About 63% of the variation in foot length is accounted for by the linear relationship formed with the arm span.arrow_forwardWe run the following regression using a sample of 148 women living in the western states. The variable wage is the hourly wage ( in USD) and educ is the number of years of education completed. wage = -3.07 + 1.52 educ Which statement best described the estimated slope coefficient? Group of answer choices A 1.52 extra years of education is predicted to increase wage by 1 USD An extra year of education is predicted to increase hourly wage by 1.52 USD A 1 percent increase in education is predicted to increase wage by 1.52 percent A 1.52 percent increase in education is predicted to increase wage by 1arrow_forward
arrow_back_ios
arrow_forward_ios
Recommended textbooks for you
- MATLAB: An Introduction with ApplicationsStatisticsISBN:9781119256830Author:Amos GilatPublisher:John Wiley & Sons Inc
 Probability and Statistics for Engineering and th...StatisticsISBN:9781305251809Author:Jay L. DevorePublisher:Cengage Learning
 Statistics for The Behavioral Sciences (MindTap C...StatisticsISBN:9781305504912Author:Frederick J Gravetter, Larry B. WallnauPublisher:Cengage Learning
  Elementary Statistics: Picturing the World (7th E...StatisticsISBN:9780134683416Author:Ron Larson, Betsy FarberPublisher:PEARSON
 The Basic Practice of StatisticsStatisticsISBN:9781319042578Author:David S. Moore, William I. Notz, Michael A. FlignerPublisher:W. H. Freeman
 Introduction to the Practice of StatisticsStatisticsISBN:9781319013387Author:David S. Moore, George P. McCabe, Bruce A. CraigPublisher:W. H. Freeman
MATLAB: An Introduction with Applications
Statistics
ISBN:9781119256830
Author:Amos Gilat
Publisher:John Wiley & Sons Inc
Probability and Statistics for Engineering and th...
Statistics
ISBN:9781305251809
Author:Jay L. Devore
Publisher:Cengage Learning
Statistics for The Behavioral Sciences (MindTap C...
Statistics
ISBN:9781305504912
Author:Frederick J Gravetter, Larry B. Wallnau
Publisher:Cengage Learning
Elementary Statistics: Picturing the World (7th E...
Statistics
ISBN:9780134683416
Author:Ron Larson, Betsy Farber
Publisher:PEARSON
The Basic Practice of Statistics
Statistics
ISBN:9781319042578
Author:David S. Moore, William I. Notz, Michael A. Fligner
Publisher:W. H. Freeman
Introduction to the Practice of Statistics
Statistics
ISBN:9781319013387
Author:David S. Moore, George P. McCabe, Bruce A. Craig
Publisher:W. H. Freeman