MATLAB: An Introduction with Applications
6th Edition
ISBN: 9781119256830
Author: Amos Gilat
Publisher: John Wiley & Sons Inc
expand_more
expand_more
format_list_bulleted
Concept explainers
Question

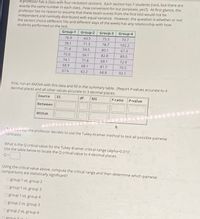
Transcribed Image Text:A professor has a class with four recitation sections. Each section has 7 students (rare, but there are
exactly the same number in each class...how convenient for our purposes, yes?). At first glance, the
professor has no reason to assume that these exam scores from the first test would not be
independent and normally distributed with equal variance. However, the question is whether or not
the section choice (different TAS and different days of the week) has any relationship with how
students performed on the test.
Group-1
Group-2 Group-3 Group-4
76.9
60.5
75.5
70.7
78.1
71.3
78,7
102.2
71.4
54.5
80.1
67.3
72.6
56.1
82.8
89.5
74.1
71.8
68.1
72.9
68.9
68.1
81.7
70.5
67.6
62.2
68.8
92.1
First, run an ANOVA with this data and fill in the summary table. (Report P-values accurate to 4
decimal places and all other values accurate to 3 decimal places.
Source
SS
df
MS
F-ratio
P-value
Between
Within
To follo.v-up, the professor decides to use the Tukey-Kramer method to test all possible pairwise
contrasts,
What is the Q critical value for the Tukey-Kramer critical range (alpha=D0.01)?
Use the table below to locate the Q critical value to 4 decimal places.
Q =
Using the critical value above, compute the critical range and then determine which pairwise
comparisons are statistically significant?
O group 1 vs. group 2
O group 1 vs. group 3
O group 1 vs. group 4
O group 2 vs. group 3
Ogroup 2 vs. group 4
O groun3 v.
Expert Solution
This question has been solved!
Explore an expertly crafted, step-by-step solution for a thorough understanding of key concepts.
This is a popular solution
Trending nowThis is a popular solution!
Step by stepSolved in 2 steps

Knowledge Booster
Learn more about
Need a deep-dive on the concept behind this application? Look no further. Learn more about this topic, statistics and related others by exploring similar questions and additional content below.Similar questions
- . What are the values of SS and variance s? for the following sample of n=3 scores? Sample: 1, 4, 7arrow_forwardand if the scores A set of 10 scores has SS= 90. If the scores are a sample, the sample variance is are a population, the population variance is O 2 - 10: ? = 10arrow_forwardThe role of the covariate is to: a.Compare variables of interest without a nuisance variable masking true differences. b.Reduce within-wroup error variance and help eliminate confounding variable bias. c.To determine the predictive power of the independent variable using odds d.A & Barrow_forward
arrow_back_ios
arrow_forward_ios
Recommended textbooks for you
 MATLAB: An Introduction with ApplicationsStatisticsISBN:9781119256830Author:Amos GilatPublisher:John Wiley & Sons Inc
 Probability and Statistics for Engineering and th...StatisticsISBN:9781305251809Author:Jay L. DevorePublisher:Cengage Learning
 Statistics for The Behavioral Sciences (MindTap C...StatisticsISBN:9781305504912Author:Frederick J Gravetter, Larry B. WallnauPublisher:Cengage Learning
 Elementary Statistics: Picturing the World (7th E...StatisticsISBN:9780134683416Author:Ron Larson, Betsy FarberPublisher:PEARSON
 The Basic Practice of StatisticsStatisticsISBN:9781319042578Author:David S. Moore, William I. Notz, Michael A. FlignerPublisher:W. H. Freeman
 Introduction to the Practice of StatisticsStatisticsISBN:9781319013387Author:David S. Moore, George P. McCabe, Bruce A. CraigPublisher:W. H. Freeman

MATLAB: An Introduction with Applications
Statistics
ISBN:9781119256830
Author:Amos Gilat
Publisher:John Wiley & Sons Inc

Probability and Statistics for Engineering and th...
Statistics
ISBN:9781305251809
Author:Jay L. Devore
Publisher:Cengage Learning

Statistics for The Behavioral Sciences (MindTap C...
Statistics
ISBN:9781305504912
Author:Frederick J Gravetter, Larry B. Wallnau
Publisher:Cengage Learning

Elementary Statistics: Picturing the World (7th E...
Statistics
ISBN:9780134683416
Author:Ron Larson, Betsy Farber
Publisher:PEARSON

The Basic Practice of Statistics
Statistics
ISBN:9781319042578
Author:David S. Moore, William I. Notz, Michael A. Fligner
Publisher:W. H. Freeman

Introduction to the Practice of Statistics
Statistics
ISBN:9781319013387
Author:David S. Moore, George P. McCabe, Bruce A. Craig
Publisher:W. H. Freeman