MATLAB: An Introduction with Applications
6th Edition
ISBN: 9781119256830
Author: Amos Gilat
Publisher: John Wiley & Sons Inc
expand_more
expand_more
format_list_bulleted
Question
Please answer and assist on questions J, K, L
Thank you.

Transcribed Image Text:h. Run a diagnosis to deterlme if the model is significant at a = 0.05. (Round test statistic to 2 decimal places and p-value to 4
decimal places)
h1. Select the correct hypothesis statements.
Ho: B1= B2 = B 3 = 0 v
H1: B1#B2 #B 3# 0 v
h2. Test Statistic:
16.26
Һз: р-value.
0.0000
h4: What is your decision regarding the null hypothesis?
Fail to reject the null. V
h5: What does this mean?
The model is significant.
1. Run a diagnosis to determine if the slope of the Individual varlables are significant at a = 0.05.
decimal places)
(Round p-values to 4
p-value
Significant (Yes, No)
No
Variable
X1
0.00
Yes
Yes
X2
0.85
X3
0.07
J. Looking at the standared error of the regression model, what is the prediction range for salary (in $ thousands)?
decimal places) +/-
(Round to 2
k. Is Multicollinearity a problem? Compute the VIF for each independent variable.
(Round VIF to 3 decimal places)
Varlable
VIF
Problem (Yes, No)
(Click to select) -
(Click to select) v
X1
X2
X3
(Click to select)
v
I. What conclusions can you draw? Are there any variables you would take out to make it better? Are there any variables you think you
might want to Include?

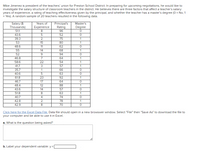
Transcribed Image Text:Mike Jimenez is president of the teachers' union for Preston School District. In preparing for upcoming negotiations, he would like to
investigate the salary structure of classroom teachers in the district. He believes there are three factors that affect a teacher's salary:
years of experience, a rating of teaching effectiveness given by the principal, and whether the teacher has a master's degree (O = No, 1
= Yes). A random sample of 20 teachers resulted in the following data.
Years of
Experience
Principal's
Rating
96
52
75
80
62
Salary ($
Thousands)
Master's
Degree
51.1
8
43.6
39.3
53
48.6
55
52
46.8
58.6
41.7
35.7
40.6
61.8
46.7
2
15
1
11
14
68
1
94
64
54
57
66
63
92
64
88
7
1
22
1
1
1
23
17
12
48.4
43.6
51.8
40.7
14
57
63
1
74
78
70
42.8
42.9
Click here for the Excel Data File. Data file should open in a new browswer window. Select "File" then "Save As" to download the file to
your computer and be able to use it in Excel.
a. What is the question being asked?
b. Label your dependent variable: y =
Expert Solution
This question has been solved!
Explore an expertly crafted, step-by-step solution for a thorough understanding of key concepts.
Step by stepSolved in 4 steps

Knowledge Booster
Similar questions
- The sale price for bananas is $3 for 4 pounds.At that rate,how much would 14 pounds of bananas cost?arrow_forwardREVIEW for Unit 3 Quiz 14 of 14 Tracy can type 180 words in 5 minutes. At this rate, how many words could she type in 12 minutes? Tracy could type words. 前 Review IIarrow_forward6. 7 V6 31 2V3arrow_forward
- Please provide Handwritten answerarrow_forwardFind the area of the part of the plane x + 4, y + z = 4 that lies in the first octant. 1. A = 12 2. A = 6V2arrow_forwardThey each have a fish tank holding 20 units of water. Whose tank holds 20 gallons, and whose holds 20 cups? Explain your reasoning.arrow_forward
arrow_back_ios
arrow_forward_ios
Recommended textbooks for you
 MATLAB: An Introduction with ApplicationsStatisticsISBN:9781119256830Author:Amos GilatPublisher:John Wiley & Sons Inc
 Probability and Statistics for Engineering and th...StatisticsISBN:9781305251809Author:Jay L. DevorePublisher:Cengage Learning
 Statistics for The Behavioral Sciences (MindTap C...StatisticsISBN:9781305504912Author:Frederick J Gravetter, Larry B. WallnauPublisher:Cengage Learning
 Elementary Statistics: Picturing the World (7th E...StatisticsISBN:9780134683416Author:Ron Larson, Betsy FarberPublisher:PEARSON
 The Basic Practice of StatisticsStatisticsISBN:9781319042578Author:David S. Moore, William I. Notz, Michael A. FlignerPublisher:W. H. Freeman
 Introduction to the Practice of StatisticsStatisticsISBN:9781319013387Author:David S. Moore, George P. McCabe, Bruce A. CraigPublisher:W. H. Freeman

MATLAB: An Introduction with Applications
Statistics
ISBN:9781119256830
Author:Amos Gilat
Publisher:John Wiley & Sons Inc

Probability and Statistics for Engineering and th...
Statistics
ISBN:9781305251809
Author:Jay L. Devore
Publisher:Cengage Learning

Statistics for The Behavioral Sciences (MindTap C...
Statistics
ISBN:9781305504912
Author:Frederick J Gravetter, Larry B. Wallnau
Publisher:Cengage Learning

Elementary Statistics: Picturing the World (7th E...
Statistics
ISBN:9780134683416
Author:Ron Larson, Betsy Farber
Publisher:PEARSON

The Basic Practice of Statistics
Statistics
ISBN:9781319042578
Author:David S. Moore, William I. Notz, Michael A. Fligner
Publisher:W. H. Freeman

Introduction to the Practice of Statistics
Statistics
ISBN:9781319013387
Author:David S. Moore, George P. McCabe, Bruce A. Craig
Publisher:W. H. Freeman