
MATLAB: An Introduction with Applications
6th Edition
ISBN: 9781119256830
Author: Amos Gilat
Publisher: John Wiley & Sons Inc
expand_more
expand_more
format_list_bulleted
Related questions
Topic Video
Question
Group of six subjects, each taught using three different methods of teaching English, had the following scores.
Test at 0.05 level significance. Assume data is normal and there is a significant difference between the means compute for the pair where the difference exist.
IF A VS B, ANSWER A
IF B VS C, ANSWER B
IF A VS. C, ANSWER C
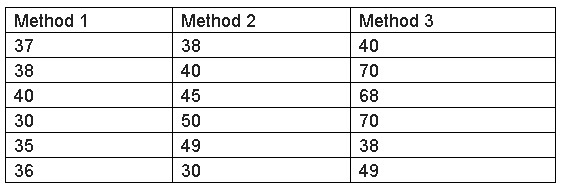

Transcribed Image Text:Method 1
Method 2
Method 3
37
38
40
38
40
70
40
45
68
30
50
70
35
49
38
36
30
49
Expert Solution
This question has been solved!
Explore an expertly crafted, step-by-step solution for a thorough understanding of key concepts.

This is a popular solution

Trending nowThis is a popular solution!

Step by stepSolved in 2 steps with 4 images

Knowledge Booster


Learn more about
Need a deep-dive on the concept behind this application? Look no further. Learn more about this topic, statistics and related others by exploring similar questions and additional content below.Similar questions
- A professor believes that his math students have different IQ than the average college students. He collected the IQ scores of 30 students in his class. Then, he compared it to the average IQ score of college students. Provided below is the data that the professor gathered.Sample:Mean: 103 Std. Dev: 7 N: 30 Population: Mean: 100 Std. Dev: 5 A). What is the type of test you will use? (z-test, single-sample t-test, paired-samples t-test, or independent samples t-test) and why (what information provided in the problem) B). What are the hypotheses (Be Specific)arrow_forwardA report summarizing scores for students on a verbal aptitude test x and a math aptitude test y gives the following results: x = 480, sx = 80, y = 500, sy = 120, r = 0.6.arrow_forwardPlease answer B, C & D.arrow_forward
- Dr. Springer collected data to see whether people who eat an all-carbohydrate meal have different scores on a mood scale than people who eat an all-protein meal. Higher scores represent better moods. Here are her results: All Carbs All Protein 10 7 8 4 7 9 9 28 13 13 7 7 12 Is there a difference in reported mood between the two groups? Use a two tailed test with an a = 0.05. Step 4: Make a decision Our test statistic has a value of t = I , and in Step 2 we found that the critical value is t* = the null hypothesis Therefore, we (write: reject or fail to reject)arrow_forwardhe level of cretaine phosphokinase (CPK) in blood samples measures the amount of muscle damage for athletes. At Jock State University, the level of CPK was determined for each of 25 football players and 15 soccer players before and after practice. The two groups of athletes are trained independently. The data summary is as follows : For football players: Data for Football players n=25 Before Practice After Practice Difference (Before-After) Mean 254.73 225.6 29.13 Standard deviation 115.5 132.6 21.00 For soccer players: Data for Soccer players n=15 Before Practice After Practice Difference (Before-After) Mean 177.1 173.8 3.3 Standard deviation 60.7 64.4 6.88 Assume that all the data above are normal Test the claim that the mean CPK level has DECREASED for soccer players AFTER exercise (compared to the mean BEFORE exercise), using α=0.10. AFTER practice, do football players have a DIFFERENT mean CPK values compared to soccer players? Test this claim by…arrow_forward1a. Which chi-square test should be used on the following study?A psychotherapist wanted to see what percentages that patients sought after four different kinds of therapy consisting of play, dance, music and group therapy. goodness of fit test of independence 1b. A school psychologist wanted to know if the class size changed from small (n=10), medium (n=25) to large (n=100) and attendance of low and high. goodness of fit test of independencearrow_forward
- Consider the following data for this question B1 B2 A1 M = 10 M = 20 A2 M = 30 M = ? The above data, what value for the missing mean would result in no interaction between A and B? Select one: a. 20 b. 30 c. 10 d. 40arrow_forward3. You would like to determine if there is a statistical relationship between the amount of caffein in a cup of coffee and their sales at their coffee franchises. The data is included in the set "Coffee by the Cup". Here is information about the variables. Variable Caffeine Cups Sold Measurement Amount of caffeine in one cup Number of cups of the coffee Units Milligrams Cups sold sold at all of the franchises a. Which variable is the explanatory variable and which variable is the response variable? b. Construct a scatterplot of the data. Based upon the scatterplot is there a linear relationship between the amount of caffeine in one cup of the coffee and the number of cups of coffee sold? Justify your reasoning using the scatterplot. c. Run a t-test for correlation using technology. Make sure you include the p-value and the printout. According to the t-test, is there a statistical relationship between the amount of caffeine in a cup of coffee and the number of cups sold? Justify your…arrow_forwardThe following table contains the number of successes and failures for three categories of a variable. Test whether the proportions are equal for each category at the a =0.01 level of significance. Category 1 Category 2 88 Category 3 = Failures 48 37 Successes 62 68 44 O B. H: The categories of the variable and success and failure are dependent. H,: The categories of the variable and sucess and failure are independent. OC. H: H, =E, and u, = E, and u =E H,: At least one mean is different from what is expected. OD. H,: The calegories of the variable and success and failure are independent. H,: The categories of the variable and success and failure are dependent. What is the P-value? (Round to three decimal places as needed.) Enter your answer in the answer box and then click Check Answer.arrow_forward
- An instructor wanted to know if his students are better at math or writing. He had students take both a math and then a writing test and he compared the results using SPSS. He found the following results: ( look at graphs ) a. What test was done?b. Report results in APA style.arrow_forwardq35arrow_forwardData was collected for a sample of organic snacks. The amount of sugar (in mg) in each snack is summarized in the histogram below. Which statement below best describes the meaning of the second bin (or class)? A. There were 65 snacks that contained 2 milligrams of sugar. B. There were 2 snacks that contained between 65 and 70 milligrams of sugar. C. There were 2 snacks that contained 65 milligrams of sugar. D. There were between 65 and 70 snacks that contained 2 milligrams of sugar. E. There were 2 snacks that contained 70 milligrams of sugar. F. There were 70 snacks that contained 2 milligrams of sugar.arrow_forward
arrow_back_ios
SEE MORE QUESTIONS
arrow_forward_ios
Recommended textbooks for you
- MATLAB: An Introduction with ApplicationsStatisticsISBN:9781119256830Author:Amos GilatPublisher:John Wiley & Sons Inc
 Probability and Statistics for Engineering and th...StatisticsISBN:9781305251809Author:Jay L. DevorePublisher:Cengage Learning
 Statistics for The Behavioral Sciences (MindTap C...StatisticsISBN:9781305504912Author:Frederick J Gravetter, Larry B. WallnauPublisher:Cengage Learning
  Elementary Statistics: Picturing the World (7th E...StatisticsISBN:9780134683416Author:Ron Larson, Betsy FarberPublisher:PEARSON
 The Basic Practice of StatisticsStatisticsISBN:9781319042578Author:David S. Moore, William I. Notz, Michael A. FlignerPublisher:W. H. Freeman
 Introduction to the Practice of StatisticsStatisticsISBN:9781319013387Author:David S. Moore, George P. McCabe, Bruce A. CraigPublisher:W. H. Freeman
MATLAB: An Introduction with Applications
Statistics
ISBN:9781119256830
Author:Amos Gilat
Publisher:John Wiley & Sons Inc
Probability and Statistics for Engineering and th...
Statistics
ISBN:9781305251809
Author:Jay L. Devore
Publisher:Cengage Learning
Statistics for The Behavioral Sciences (MindTap C...
Statistics
ISBN:9781305504912
Author:Frederick J Gravetter, Larry B. Wallnau
Publisher:Cengage Learning
Elementary Statistics: Picturing the World (7th E...
Statistics
ISBN:9780134683416
Author:Ron Larson, Betsy Farber
Publisher:PEARSON
The Basic Practice of Statistics
Statistics
ISBN:9781319042578
Author:David S. Moore, William I. Notz, Michael A. Fligner
Publisher:W. H. Freeman
Introduction to the Practice of Statistics
Statistics
ISBN:9781319013387
Author:David S. Moore, George P. McCabe, Bruce A. Craig
Publisher:W. H. Freeman