ENGR.ECONOMIC ANALYSIS
14th Edition
ISBN: 9780190931919
Author: NEWNAN
Publisher: Oxford University Press
expand_more
expand_more
format_list_bulleted
Question
I do not know which is which to add together to find

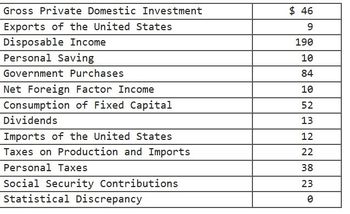
Transcribed Image Text:### Economic Data Overview
This table presents various components of a nation's income and expenditure, critical for understanding economic activity. Here is a breakdown of each item:
1. **Gross Private Domestic Investment**: $46
- Represents the total spending on goods that will be used for future production.
2. **Exports of the United States**: $9
- The total value of goods and services sold to foreign countries.
3. **Disposable Income**: $190
- The total personal income available to households after taxes, the amount they can spend or save.
4. **Personal Saving**: $10
- The portion of disposable income that households save rather than spend on consumption.
5. **Government Purchases**: $84
- Refers to goods and services purchased by the government sector.
6. **Net Foreign Factor Income**: $10
- Income residents receive from abroad for providing factor services minus similar payments made to non-residents.
7. **Consumption of Fixed Capital**: $52
- Depreciation of the nation's stock of capital goods over time.
8. **Dividends**: $13
- The portion of corporate profits paid out to shareholders.
9. **Imports of the United States**: $12
- The total value of goods and services purchased from abroad.
10. **Taxes on Production and Imports**: $22
- Taxes imposed on goods and services produced domestically and imported.
11. **Personal Taxes**: $38
- Taxes paid by individuals on their income, including federal and state taxes.
12. **Social Security Contributions**: $23
- Payments made to social security programs, deducted from wages.
13. **Statistical Discrepancy**: $0
- Used to reconcile any difference between aggregate income and aggregate expenditure.
This data provides an insight into the economic activities and financial flows within this context.

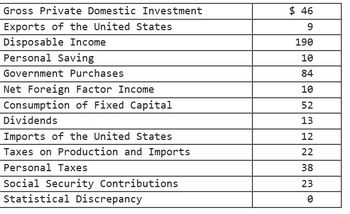
Transcribed Image Text:**Economic Data Table**
1. **Gross Private Domestic Investment**: $46
2. **Exports of the United States**: $9
3. **Disposable Income**: $190
4. **Personal Saving**: $10
5. **Government Purchases**: $84
6. **Net Foreign Factor Income**: $10
7. **Consumption of Fixed Capital**: $52
8. **Dividends**: $13
9. **Imports of the United States**: $12
10. **Taxes on Production and Imports**: $22
11. **Personal Taxes**: $38
12. **Social Security Contributions**: $23
13. **Statistical Discrepancy**: $0
This table provides a snapshot of various economic indicators that help in analyzing the economic activities of a country. Each item represents a different aspect of the economy, showing the flow of financial resources in various sectors from investment to public spending. Understanding these indicators is crucial for evaluating economic health and making informed policy decisions.
Expert Solution
arrow_forward
Step 1: Define National income
GDP is the gross domestic product.
GDP is defined as the market value of all the final goods and services produced in an economy within the period of one year.
GDP or Aggregate demand is the sum of consumption, investment, government spending and net export.
This means,
AD = C + I + G + NX
NX = X - M
Where,
C is consumption
I is investment
G is government spending
NX is net export
X is export
M is import.
NNP(FC) = GDP - Consumption of fixed capital +Net factor income from abroad (NFIA)
NNP(FC) is also known as National income.
NNP(FC) is Net National Product at factor cost.
Trending nowThis is a popular solution!
Step by stepSolved in 3 steps

Knowledge Booster
Learn more about
Need a deep-dive on the concept behind this application? Look no further. Learn more about this topic, economics and related others by exploring similar questions and additional content below.Similar questions
arrow_back_ios
arrow_forward_ios
Recommended textbooks for you

 Principles of Economics (12th Edition)EconomicsISBN:9780134078779Author:Karl E. Case, Ray C. Fair, Sharon E. OsterPublisher:PEARSON
 Engineering Economy (17th Edition)EconomicsISBN:9780134870069Author:William G. Sullivan, Elin M. Wicks, C. Patrick KoellingPublisher:PEARSON
 Principles of Economics (MindTap Course List)EconomicsISBN:9781305585126Author:N. Gregory MankiwPublisher:Cengage Learning
 Managerial Economics: A Problem Solving ApproachEconomicsISBN:9781337106665Author:Luke M. Froeb, Brian T. McCann, Michael R. Ward, Mike ShorPublisher:Cengage Learning
 Managerial Economics & Business Strategy (Mcgraw-...EconomicsISBN:9781259290619Author:Michael Baye, Jeff PrincePublisher:McGraw-Hill Education


Principles of Economics (12th Edition)
Economics
ISBN:9780134078779
Author:Karl E. Case, Ray C. Fair, Sharon E. Oster
Publisher:PEARSON

Engineering Economy (17th Edition)
Economics
ISBN:9780134870069
Author:William G. Sullivan, Elin M. Wicks, C. Patrick Koelling
Publisher:PEARSON

Principles of Economics (MindTap Course List)
Economics
ISBN:9781305585126
Author:N. Gregory Mankiw
Publisher:Cengage Learning

Managerial Economics: A Problem Solving Approach
Economics
ISBN:9781337106665
Author:Luke M. Froeb, Brian T. McCann, Michael R. Ward, Mike Shor
Publisher:Cengage Learning

Managerial Economics & Business Strategy (Mcgraw-...
Economics
ISBN:9781259290619
Author:Michael Baye, Jeff Prince
Publisher:McGraw-Hill Education