
Practical Management Science
6th Edition
ISBN: 9781337406659
Author: WINSTON, Wayne L.
Publisher: Cengage,
expand_more
expand_more
format_list_bulleted
Related questions
Question
Need to use the excel sheet to fill. thank you
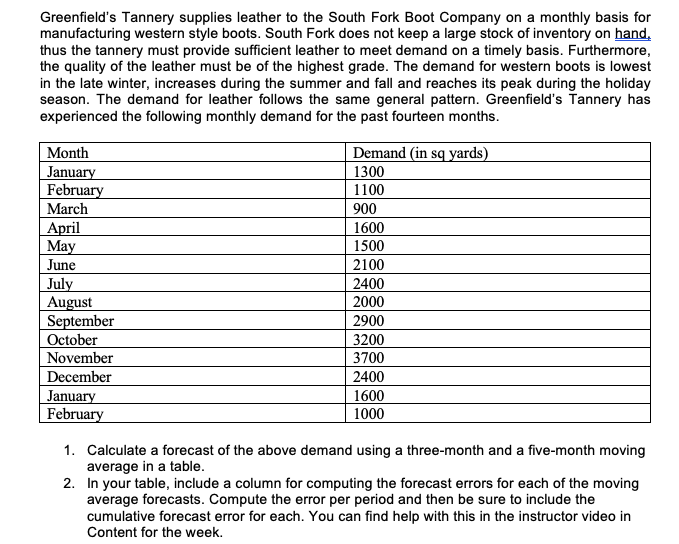

Transcribed Image Text:Greenfield's Tannery supplies leather to the South Fork Boot Company on a monthly basis for
manufacturing western style boots. South Fork does not keep a large stock of inventory on hand,
thus the tannery must provide sufficient leather to meet demand on a timely basis. Furthermore,
the quality of the leather must be of the highest grade. The demand for western boots is lowest
in the late winter, increases during the summer and fall and reaches its peak during the holiday
season. The demand for leather follows the same general pattern. Greenfield's Tannery has
experienced the following monthly demand for the past fourteen months.
Demand (in sq yards)
Month
January
February
1300
1100
March
900
April
Мay
1600
1500
June
2100
July
August
September
October
November
2400
2000
2900
3200
3700
December
2400
January
February
1600
1000
1. Calculate a forecast of the above demand using a three-month and a five-month moving
average in a table.
2. In your table, include a column for computing the forecast errors for each of the moving
average forecasts. Compute the error per period and then be sure to include the
cumulative forecast error for each. You can find help with this in the instructor video in
Content for the week.

Transcribed Image Text:Greenfield's Tannery Template
#1 - Average Forecast: 3 Month Moving Average
#2 - Average Forecast: 5 Month Moving Average
At
5 Month
Moving Avg
At
Ft
3 Month
Moving Avg
Ft
5 Month
Forecast
Cumulative
Dt
Forecast
Cumulative
Dt
Demand
3 Month
Forecast
Error
Period
Forecast
Forecast Error
Period Demand
Error
Forecast Error
1
1300
1300
1100
2
1100
3
900
3
900
4
1600
4
1600
1500
1500
2100
6
2100
7
2400
2400
8
2000
8
2000
9
2900
9
2900
10
3200
10
3200
11
3700
11
3700
12
2400
12
2400
13
1600
13
1600
14
1000
14
1000
Expert Solution
This question has been solved!
Explore an expertly crafted, step-by-step solution for a thorough understanding of key concepts.

This is a popular solution

Trending nowThis is a popular solution!

Step by stepSolved in 3 steps with 2 images

Knowledge Booster


Learn more about
Need a deep-dive on the concept behind this application? Look no further. Learn more about this topic, operations-management and related others by exploring similar questions and additional content below.Similar questions
- Ali has been given the task of arranging for five-day training for foreign delegates. In order to ensure smooth functioning of the event, he has appointed one person in accounting department. Identify the nature of manager of accountant appointed in this situation. a. Staff b. Middle Staff c. Top Line d. Linearrow_forwardWho are "accelerated filers," and how are they selected (by revenue or employee numbers)?arrow_forwardWhich best describes a career that would rely on both and employer and the federal government for fundingarrow_forward
- You’re responsible for updating the contract details for a third party contracted manufacturer of Marmite on SAP, our supply chain management software. You need to liaise with different people in different departments to gather the information: volumes from planning, pricing from manufacturing and location from transportation. There is one day left to complete the task and yet, despite repeated requests by email and phone, your contact in manufacturing has not responded to your request. So I would like to hear from you: • What steps would you take to gather the information before the deadline? • If you couldn’t obtain the information before the deadline what would you do? • If you weren’t successful in obtaining the information before the deadline, how would you feearrow_forwardLet's say the following numbers are available after an analysis, what is the CTO? (contribution to overhead) Sales = $ 1.00 Variable costs = 0.8964 What is the CTO? This means the amount that can be applied. to overhead after all variable costs are paid. This was calculated as a % of sales. 7. Calculate breakeven point. How many units (dollars) of sales are needed to completely cover all costs? Breakeven = Fixed costs_ Sales dollars) 1.0 Variable costs as a portion of net sales Breakeven = Fixed Costs. Selling price per unit - variable cost per unit Fixed costs are $1,149,722. CTO figure from above. Calculate the breakeven sales volume in dollars Write your answer here. (Sales units)arrow_forwardExplain how managerial accounting can be used for managerial task. Consider planning and control. Please Answer ASAparrow_forward
- Please written by computer source 1. What time of Management Level is Accounting? (Operational, Tactical, or Strategic Management).arrow_forwardI need help with the following questions refering to the image below. The information for Titan Company, shown in following chart, is available from Titan's time records and the employee's individual earnings records for the pay period ended December 22. 1. Complete the payroll register using a Social Security tax rate of 6.2 percent and a Medicare tax rate of 1.45 percent. Concerning Other Deductions, AR refers to Accounts Recievable and UW refers to United Way. Begin payroll checks in the payroll register with No. 2914. 2. Prepare the general journal entry to record the payroll. The firm's general ledger contains a Salary Expense account and a Salaries Payable account. 3. Prepare the general journal entry to pay the payroll. Assume that funds for this payroll have been transferred to Cash-Payroll Bank Account and that this entry has been made.arrow_forwarddo fast and step by step calculation dont use chatgptarrow_forward
- What is the difference between tangible and intangible resources? Which do you find to be more valuable to a company and why?arrow_forwardDiscuss the reasons behind a bumpy rollout of an Enterprise Resource Planningsystemarrow_forwardWhy is estimating operation and implementation costs in budgeting important?arrow_forward
arrow_back_ios
SEE MORE QUESTIONS
arrow_forward_ios
Recommended textbooks for you
- Practical Management ScienceOperations ManagementISBN:9781337406659Author:WINSTON, Wayne L.Publisher:Cengage,
 Operations ManagementOperations ManagementISBN:9781259667473Author:William J StevensonPublisher:McGraw-Hill Education
 Operations and Supply Chain Management (Mcgraw-hi...Operations ManagementISBN:9781259666100Author:F. Robert Jacobs, Richard B ChasePublisher:McGraw-Hill Education
 Purchasing and Supply Chain ManagementOperations ManagementISBN:9781285869681Author:Robert M. Monczka, Robert B. Handfield, Larry C. Giunipero, James L. PattersonPublisher:Cengage Learning
 Production and Operations Analysis, Seventh Editi...Operations ManagementISBN:9781478623069Author:Steven Nahmias, Tava Lennon OlsenPublisher:Waveland Press, Inc.
Practical Management Science
Operations Management
ISBN:9781337406659
Author:WINSTON, Wayne L.
Publisher:Cengage,
Operations Management
Operations Management
ISBN:9781259667473
Author:William J Stevenson
Publisher:McGraw-Hill Education
Operations and Supply Chain Management (Mcgraw-hi...
Operations Management
ISBN:9781259666100
Author:F. Robert Jacobs, Richard B Chase
Publisher:McGraw-Hill Education
Purchasing and Supply Chain Management
Operations Management
ISBN:9781285869681
Author:Robert M. Monczka, Robert B. Handfield, Larry C. Giunipero, James L. Patterson
Publisher:Cengage Learning
Production and Operations Analysis, Seventh Editi...
Operations Management
ISBN:9781478623069
Author:Steven Nahmias, Tava Lennon Olsen
Publisher:Waveland Press, Inc.