A First Course in Probability (10th Edition)
10th Edition
ISBN: 9780134753119
Author: Sheldon Ross
Publisher: PEARSON
expand_more
expand_more
format_list_bulleted
Question

Transcribed Image Text:8°F
Vindy
Question 3
Question submitted.
> Next question You can retry this question below
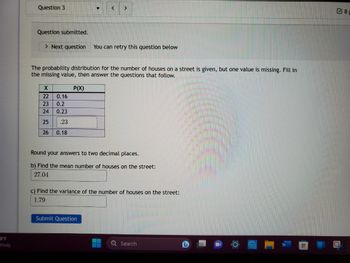
The probability distribution for the number of houses on a street is given, but one value is missing. Fill in
the missing value, then answer the questions that follow.
P(X)
X
22
23
24
25
26
++
< >
0.16
0.2
0.23
.23
0.18
Round your answers to two decimal places.
b) Find the mean number of houses on the street:
27.04
c) Find the variance of the number of houses on the street:
1.79
Submit Question
Q Search
H
8p
Expert Solution
This question has been solved!
Explore an expertly crafted, step-by-step solution for a thorough understanding of key concepts.
Step by stepSolved in 5 steps with 3 images

Knowledge Booster
Similar questions
- Write True or False for the statement. If the statement is False, correct the statement. You are shown the following normal probability plot where the data set percentiles are on the y-axis. The sample size is n = 1,000. The data set can best be described as skewed to the left. Normal Q-Q Plot 2 -3arrow_forwardHelp.explain.arrow_forwardThe ages (in years) of a random sample of shoppers at a gaming store are shown. Determine the range, mean, variance, and standard deviation of the sample data set. 12, 19, 23, 14, 20, 17, 22, 16, 14, 18 0 The range is (Simplify your answer.) The mean is (Simplify your answer. Round to the nearest tenth as needed.) The variance is (Simplify your answer. Round to the nearest tenth as needed.) The standard deviation is (Simplify your answer. Round to the nearest tenth as needed.)arrow_forward
- The ages (in years) of a random sample of shoppers at a gaming store are shown. Determine the range, mean, variance, and standard deviation of the sample data set. 12, 20, 23, 13, 18, 17, 22, 17, 15, 16 The range is The mean is ( Simplify your answer. Round to the nearest tenth as needed.) The variance is (Simplify your answer. Round to the nearest hundredth as needed.) The standard deviation is (Simplify your answer. Round to the nearest tenth as needed.) Can you please explain me this math problem having trouble understanding. Thank you.arrow_forwardFind the range, the standard deviation, and the variance for the given samples. Round non-integer results to the nearest tenth. -29, -14, –10, –17, –4, –13, -26 range standard deviation variance Need Help? Watch Itarrow_forwardThe top 16 winning scores for NFL games are listed below. Find the mean score. Video Tutorial: How to find the mean on a TI-84 72 54 52 54 70 51 56 58 58 52 51 63 51 48 52 61 A. 54 B. 57.1 C. 63.2 D. 56.4arrow_forward
- one z-score unit is equivalent to ______ of the distribution. a. the variance b. the range c. the standard deviation d. the mean e. the correlation coefficientarrow_forwardThe ages (in years) of a random sample of shoppers at a gaming store are shown. Determine the range, mean, variance, and standard deviation of the sample data set. 12, 19, 23, 14, 16, 16, 22, 16, 15, 19 The range is (Simplify your answer.) The mean is (Simplify your answer. Round to the nearest tenth as needed.) The variance is (Simplify your answer. Round to the nearest tenth as needed.) The standard deviation is (Simplify your answer. Round to the nearest tenth as needed.)arrow_forwardMitchell is getting ready to take a baseball rules exam in order to becomne certified as a baseball umnpire in his local community. Past scores on the rules exam form a normal distribution with u = 80 and o = 6. Mitchell must score in the highest 25% of the distribution in order to become a certified umpire. Which minimum score does Mitchell need to obtain on the rules exam to become a certified umpire? OX= 76 O X- 84 OX= 86 OX-81arrow_forward
- R1arrow_forwardFind the sample variances of the data sets A and B given below. A:3, 4, 6,7, 10 B:-20, 5, 15, 24arrow_forwardJamie’s Intro to Biology professor tells the class that on the first exam, the mean score is a 70, but the median score is an 84. What does this tell you about the skewness of the distribution? What measures of center and spread would you use to describe this distribution? a. The distribution is skewed left, so we should use the mean and the median to describe the distribution. b. The distribution is skewed left, so we should use the median and the IQR to describe the distribution. c. The distribution is skewed right, so we should use the median and the IQR to describe the distribution. d. The distribution is symmetric, so we should use the standard deviation and the IQR to describe the distribution. e. The distribution is skewed right, so we should use the mean and the IQR to describe the distribution.arrow_forward
arrow_back_ios
SEE MORE QUESTIONS
arrow_forward_ios
Recommended textbooks for you
 A First Course in Probability (10th Edition)ProbabilityISBN:9780134753119Author:Sheldon RossPublisher:PEARSON

A First Course in Probability (10th Edition)
Probability
ISBN:9780134753119
Author:Sheldon Ross
Publisher:PEARSON
