
MATLAB: An Introduction with Applications
6th Edition
ISBN: 9781119256830
Author: Amos Gilat
Publisher: John Wiley & Sons Inc
expand_more
expand_more
format_list_bulleted
Related questions
Question
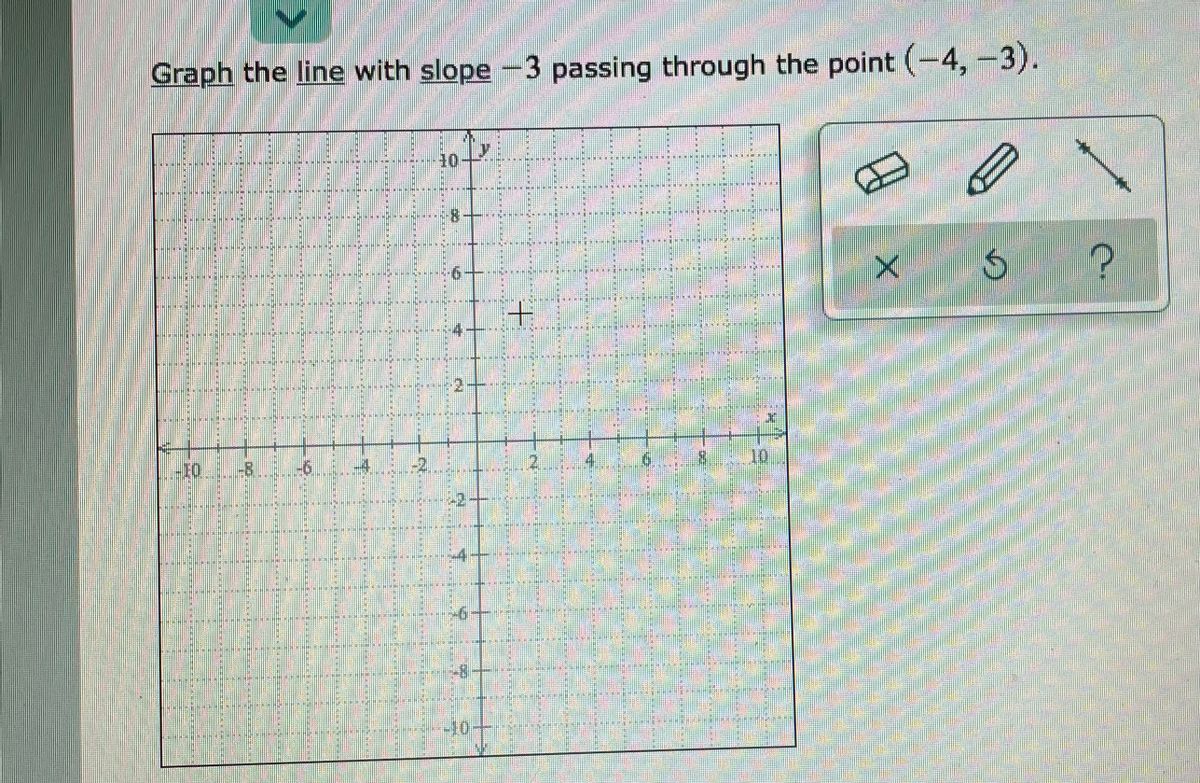

Transcribed Image Text:Title: Graphing a Line with a Given Slope and Point
Content:
To graph a line with a slope of -3 that passes through the point (-4, -3), follow these steps:
1. **Identify the Point**: Start by locating the point (-4, -3) on the graph. This is where your line will pass through.
2. **Understand the Slope**: The slope is -3, which means that for every 1 unit you move to the right along the x-axis, you will move 3 units down along the y-axis.
3. **Plot a Second Point Using the Slope**: From the point (-4, -3), move 1 unit to the right (to -3 on the x-axis) and 3 units down (to -6 on the y-axis). Mark this second point.
4. **Draw the Line**: Use a ruler to draw a line through these two points, extending it in both directions.
Visual Explanation:
The graph provided is a standard Cartesian coordinate system with x and y axes intersecting at origin (0,0). The grid allows accurate plotting of points and the slope.
Tools Available:
- **Eraser Icon**: To remove elements from the graph.
- **Pencil Icon**: To draw points or lines.
- **Line Tool**: To create straight lines between points.
- **Other Icons**: Include an undo function and help for assistance.
This exercise demonstrates how to graph a linear equation using a point-slope approach.
Expert Solution
This question has been solved!
Explore an expertly crafted, step-by-step solution for a thorough understanding of key concepts.

This is a popular solution

Trending nowThis is a popular solution!

Step by stepSolved in 2 steps with 2 images

Knowledge Booster

Similar questions
arrow_back_ios
arrow_forward_ios
Recommended textbooks for you
- MATLAB: An Introduction with ApplicationsStatisticsISBN:9781119256830Author:Amos GilatPublisher:John Wiley & Sons Inc
 Probability and Statistics for Engineering and th...StatisticsISBN:9781305251809Author:Jay L. DevorePublisher:Cengage Learning
 Statistics for The Behavioral Sciences (MindTap C...StatisticsISBN:9781305504912Author:Frederick J Gravetter, Larry B. WallnauPublisher:Cengage Learning
  Elementary Statistics: Picturing the World (7th E...StatisticsISBN:9780134683416Author:Ron Larson, Betsy FarberPublisher:PEARSON
 The Basic Practice of StatisticsStatisticsISBN:9781319042578Author:David S. Moore, William I. Notz, Michael A. FlignerPublisher:W. H. Freeman
 Introduction to the Practice of StatisticsStatisticsISBN:9781319013387Author:David S. Moore, George P. McCabe, Bruce A. CraigPublisher:W. H. Freeman
MATLAB: An Introduction with Applications
Statistics
ISBN:9781119256830
Author:Amos Gilat
Publisher:John Wiley & Sons Inc
Probability and Statistics for Engineering and th...
Statistics
ISBN:9781305251809
Author:Jay L. Devore
Publisher:Cengage Learning
Statistics for The Behavioral Sciences (MindTap C...
Statistics
ISBN:9781305504912
Author:Frederick J Gravetter, Larry B. Wallnau
Publisher:Cengage Learning
Elementary Statistics: Picturing the World (7th E...
Statistics
ISBN:9780134683416
Author:Ron Larson, Betsy Farber
Publisher:PEARSON
The Basic Practice of Statistics
Statistics
ISBN:9781319042578
Author:David S. Moore, William I. Notz, Michael A. Fligner
Publisher:W. H. Freeman
Introduction to the Practice of Statistics
Statistics
ISBN:9781319013387
Author:David S. Moore, George P. McCabe, Bruce A. Craig
Publisher:W. H. Freeman