Advanced Engineering Mathematics
10th Edition
ISBN: 9780470458365
Author: Erwin Kreyszig
Publisher: Wiley, John & Sons, Incorporated
expand_more
expand_more
format_list_bulleted
Question
answer is D

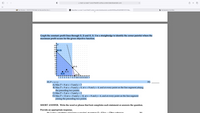
Transcribed Image Text:**Graph the Constant-Profit Lines and Identify Maximum Profit Points**
*Objective:* Use a straightedge to identify the corner point(s) where the maximum profit occurs for the given objective function.
**Graph Explanation:**
- The graph displayed shows a coordinate plane with various points marked and shaded regions.
- The objective function is represented as \( P = x + y \).
- The feasible region, which is shaded in blue, is bounded by the lines and axes.
- Key points are plotted on the graph: (3, 2), (5, 3), (8, 4), and (0, 12).
- The line passing through these points represents constant-profit lines.
**Options for Maximum Profit (Point 35):**
A) Max \( P = 8 \) at \( x = 5 \) and \( y = 3 \)
B) Max \( P = 9 \) at \( x = 9 \) and \( y = 0 \), at \( x = 8 \) and \( y = 4 \), and at every point on the line segment joining the preceding two points.
C) Max \( P = 5 \) at \( x = 3 \) and \( y = 2 \)
D) Max \( P = 12 \) at \( x = 0 \) and \( y = 12 \), at \( x = 8 \) and \( y = 4 \), and at every point on the line segment joining the preceding two points.
**Task:**
Select the word or phrase that best completes each statement or answers the question.
*Provide an appropriate response.*
- Maximizing the objective given in the function by finding the right combination of variables involves analyzing these line segments and points for optimal solutions within the constraints of the given problem.
Expert Solution
This question has been solved!
Explore an expertly crafted, step-by-step solution for a thorough understanding of key concepts.
This is a popular solution
Trending nowThis is a popular solution!
Step by stepSolved in 2 steps

Knowledge Booster
Similar questions
arrow_back_ios
arrow_forward_ios
Recommended textbooks for you
 Advanced Engineering MathematicsAdvanced MathISBN:9780470458365Author:Erwin KreyszigPublisher:Wiley, John & Sons, Incorporated
 Numerical Methods for EngineersAdvanced MathISBN:9780073397924Author:Steven C. Chapra Dr., Raymond P. CanalePublisher:McGraw-Hill Education
 Introductory Mathematics for Engineering Applicat...Advanced MathISBN:9781118141809Author:Nathan KlingbeilPublisher:WILEY
 Mathematics For Machine TechnologyAdvanced MathISBN:9781337798310Author:Peterson, John.Publisher:Cengage Learning,


Advanced Engineering Mathematics
Advanced Math
ISBN:9780470458365
Author:Erwin Kreyszig
Publisher:Wiley, John & Sons, Incorporated

Numerical Methods for Engineers
Advanced Math
ISBN:9780073397924
Author:Steven C. Chapra Dr., Raymond P. Canale
Publisher:McGraw-Hill Education

Introductory Mathematics for Engineering Applicat...
Advanced Math
ISBN:9781118141809
Author:Nathan Klingbeil
Publisher:WILEY

Mathematics For Machine Technology
Advanced Math
ISBN:9781337798310
Author:Peterson, John.
Publisher:Cengage Learning,

