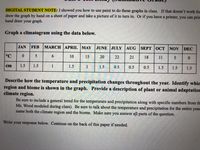
Graph a climatogram using the data below. JAN FEB MARCH APRIL MAY JUNE JULY AUG SEPT |OСТ |NOV DEC °C 6. 10 15 20 22 21 18 11 0. cm 1.5 1.5 1 1.5 1 1.5 0.5 0.5 0.5 1.5 1.5 1.5 Describe how the temperature and precipitation changes throughout the year. Identify wh region and biome is shown in the graph. Provide a description of plant or animal adaptati climate region. Be sure to include a general trend for the temperature and precipitation along with specific numbers from Ms. Wood modeled during class). Be sure to talk about the temperature and precipitation for the entire ye name both the climate region and the biome. Make sure you answer all parts of the question.

icon
Related questions
Question
I need help graphing this
DIGITAL STUDENT NOTE: I showed you how to use paint to do these graphs in class. If that doesn't work for
draw the graph by hand on a sheet of paper and take a picture of it to turn in. Or if you have a printer, you can prir
hand draw your graph.
Graph a climatogram using the data below.
JAN
FEB
MARCH APRIL MAY
JUNE JULY AUG
SEPT |OСТ
NOV
DEC
°C
6.
10
15
20
22
21
18
11
0.
cm
1.5
1.5
1
1.5
1
1.5
0.5
0.5
0.5
1.5
1.5
1.5
Describe how the temperature and precipitation changes throughout the year. Identify whic
region and biome is shown in the graph. Provide a description of plant or animal adaptation
climate region.
Be sure to include a general trend for the temperature and precipitation along with specific numbers from th
Ms. Wood modeled during class). Be sure to talk about the temperature and precipitation for the entire
name both the climate region and the biome. Make sure you answer all parts of the question.
year
Write your response below. Continue on the back of this paper if needed.
Transcribed Image Text:DIGITAL STUDENT NOTE: I showed you how to use paint to do these graphs in class. If that doesn't work for draw the graph by hand on a sheet of paper and take a picture of it to turn in. Or if you have a printer, you can prir hand draw your graph. Graph a climatogram using the data below. JAN FEB MARCH APRIL MAY JUNE JULY AUG SEPT |OСТ NOV DEC °C 6. 10 15 20 22 21 18 11 0. cm 1.5 1.5 1 1.5 1 1.5 0.5 0.5 0.5 1.5 1.5 1.5 Describe how the temperature and precipitation changes throughout the year. Identify whic region and biome is shown in the graph. Provide a description of plant or animal adaptation climate region. Be sure to include a general trend for the temperature and precipitation along with specific numbers from th Ms. Wood modeled during class). Be sure to talk about the temperature and precipitation for the entire name both the climate region and the biome. Make sure you answer all parts of the question. year Write your response below. Continue on the back of this paper if needed.
Expert Solution
trending now

Trending now

This is a popular solution!

steps

Step by step

Solved in 3 steps

Blurred answer