MATLAB: An Introduction with Applications
6th Edition
ISBN: 9781119256830
Author: Amos Gilat
Publisher: John Wiley & Sons Inc
expand_more
expand_more
format_list_bulleted
Question
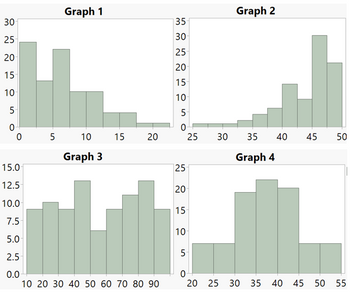
1st graph
a. Which of the graphs above is right skewed?
b. Which of the graphs above has a
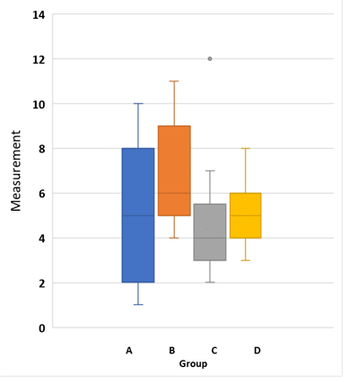
graph 2
You are studying objects from four groups: A, B, C, and D. You take measurements on each object in the groups.
110 a. The middle 50% of objects in group A have a measurement between and
Question 2
b. Which group has the largest range ?
Question 3
c. The median of group C is .

Transcribed Image Text:Graph 1
Graph 2
30
35
25
30
25
20
20
15
15
10
10
5
5
0
0
0
5
10
15
20
20
25
25
30
35
40 45
Graph 3
Graph 4
22
25
20
15
50
50
7.5
10
5.0
5
2.5
0.0
0
10 20 30 40 50 60 70 80 90
20 25 30 35 40 45 50 55
15.0
12.5
10.0

Transcribed Image Text:2
Measurement
00
10
0
A
B
Group
22
14
C D
Expert Solution
This question has been solved!
Explore an expertly crafted, step-by-step solution for a thorough understanding of key concepts.
Step by stepSolved in 2 steps

Knowledge Booster
Similar questions
- A newspaper collected information on schools in its circulation area in order to compare their quality. Two Which is a true statement regarding Springside? measures the newspaper collected for each school, O Springside does not affect the correlation. mean class size and mean score on a statewide O Springside weakens the correlation shown in the scatterplot. reading exam, are shown in the scatterplot. One school in the report, Springside Elementary, is labeled in the graph. O Springside strengthens the correlation shown in the scatterplot. O Removing Springside would increase the value of the correlation coefficient. Comparing Schools 90 Springside 70 60 50 40 Save and Exit Next Submit Mark this and return ContentViewers/AssessmentViewer/Activity# ch hp Mean State Test Scorearrow_forward2. For the data set below, do a complete boxplot analysis. This includes finding the quartiles, the range, the interquartile range, inner fences, and outer fences. Make sure you draw the graph. Then tell me whether the highest observation is reliable, a mild outlier, or an extreme outlier. 9, 11, 13, 14, 16, 17, 17, 18, 19, 20, 35.arrow_forwardQ.5. Find the median if the mean and mode are given as 35 and 30 respectively?arrow_forward
- i need helparrow_forwardUse the same scales to construct modified boxplots for the pulse rates of males and females from the accompanying data sets. Identify any outliers. Use the boxplots to compare the two data sets. Click the icon to view the data sets. Determine the boxplot for the men's pulse rate data. Choose the correct graph below. O A. O C. xx HE 40 50 60 70 80 90 100110 O C. What points are outliers? OA. 46 O B. 46, 89, 105 OC. 46, 48, 105 O D. 105 40 50 60 70 80 90 100110 -ידי xH Determine the boxplot for the women's boxplot data. Choose the correct graph below. O A. Q 40 50 60 70 80 90 100110 xH Q 40 50 60 70 80 90 100110 Q ✔ Q ✔ C O B. O D. O B. O D. 841x 40 50 60 70 80 90 100110 X 40 50 60 70 80 90 100110 40 50 60 70 80 90 100110 XX 40 50 60 70 80 90 100110 Q Q M Q Q ✔ Pulse rates for men and women Men's Pulse Rates 59 72 72 58 84 50 58 65 66 55 105 64 65 77 70 62 Women's Pulse Rates 76 70 74 83 59 67 65 72 74 89 85 78 56 80 60 46 70 59 70 75 66 68 66 72 77 78 97 74 62 81 54 74 77 79 89 95 59 98…arrow_forwardThe table below shows the number of books the Jefferson Middle school students readeach month for nine months. If the students read only 101 books for the month of June, which measure of central tendency will have the greatest change?A. All measures will have an equal change.B. The median will have the greatest change.C. The mean will have the greatest change.D. The mode will have the greatest change.arrow_forward
- Which of the following is not a measure of central tendency?A. the medianB. the modeC. the meanD. the rangeE. all of the above show measure of central tendencyarrow_forwardA pediatrician wants to determine the relation that may exist between a child's height and head circumference. She randomly selects 8 children from her practice, measures their height and head circumference and obtains the data shown below. Height Head Circumference 27 17.5 25 17 26.5 17.2 25.5 17 27.75 17.4 26.25 17.4 26 17.1 27.25 17.4 data table n 3 0.997 4 0.950 5 0.878 6 0.811 7 0.754 8 0.707 9 0.666 10 0.632 11 0.602 12 0.576 13 0.553 14 0.532 15 0.514 16 0.497 17 0.482 18 0.468 19 0.456 20 0.444 21 0.433 22 0.423 23 0.413 24 0.404 25 0.396 26 0.388 27 0.381 28 0.374 29 0.367 30 0.361 compute the linear correlation coefficient between the height and head circumference of a child. r = ____ (round to three decimal places as…arrow_forwardThe red blood cell count of a healthy person was measured on each of 15 days. The number recorded is measured in 106 cells per microliter. 5.4 5.2 5.0 5.2 5.55.3 5.4 5.2 5.1 5.35.3 4.9 5.4 5.2 5.2 A. Choose from the choices the most applicable graph to describe the data. - dotplot, histogram, stem leaf plot, or line graph? Why? B. Describe the shape of the data distribution. Explain your answer. C. Describe the location of the red blood cell counts. Explain your answer.arrow_forward
arrow_back_ios
arrow_forward_ios
Recommended textbooks for you
 MATLAB: An Introduction with ApplicationsStatisticsISBN:9781119256830Author:Amos GilatPublisher:John Wiley & Sons Inc
 Probability and Statistics for Engineering and th...StatisticsISBN:9781305251809Author:Jay L. DevorePublisher:Cengage Learning
 Statistics for The Behavioral Sciences (MindTap C...StatisticsISBN:9781305504912Author:Frederick J Gravetter, Larry B. WallnauPublisher:Cengage Learning
 Elementary Statistics: Picturing the World (7th E...StatisticsISBN:9780134683416Author:Ron Larson, Betsy FarberPublisher:PEARSON
 The Basic Practice of StatisticsStatisticsISBN:9781319042578Author:David S. Moore, William I. Notz, Michael A. FlignerPublisher:W. H. Freeman
 Introduction to the Practice of StatisticsStatisticsISBN:9781319013387Author:David S. Moore, George P. McCabe, Bruce A. CraigPublisher:W. H. Freeman

MATLAB: An Introduction with Applications
Statistics
ISBN:9781119256830
Author:Amos Gilat
Publisher:John Wiley & Sons Inc

Probability and Statistics for Engineering and th...
Statistics
ISBN:9781305251809
Author:Jay L. Devore
Publisher:Cengage Learning

Statistics for The Behavioral Sciences (MindTap C...
Statistics
ISBN:9781305504912
Author:Frederick J Gravetter, Larry B. Wallnau
Publisher:Cengage Learning

Elementary Statistics: Picturing the World (7th E...
Statistics
ISBN:9780134683416
Author:Ron Larson, Betsy Farber
Publisher:PEARSON

The Basic Practice of Statistics
Statistics
ISBN:9781319042578
Author:David S. Moore, William I. Notz, Michael A. Fligner
Publisher:W. H. Freeman

Introduction to the Practice of Statistics
Statistics
ISBN:9781319013387
Author:David S. Moore, George P. McCabe, Bruce A. Craig
Publisher:W. H. Freeman