
A First Course in Probability (10th Edition)
10th Edition
ISBN: 9780134753119
Author: Sheldon Ross
Publisher: PEARSON
expand_more
expand_more
format_list_bulleted
Related questions
Question
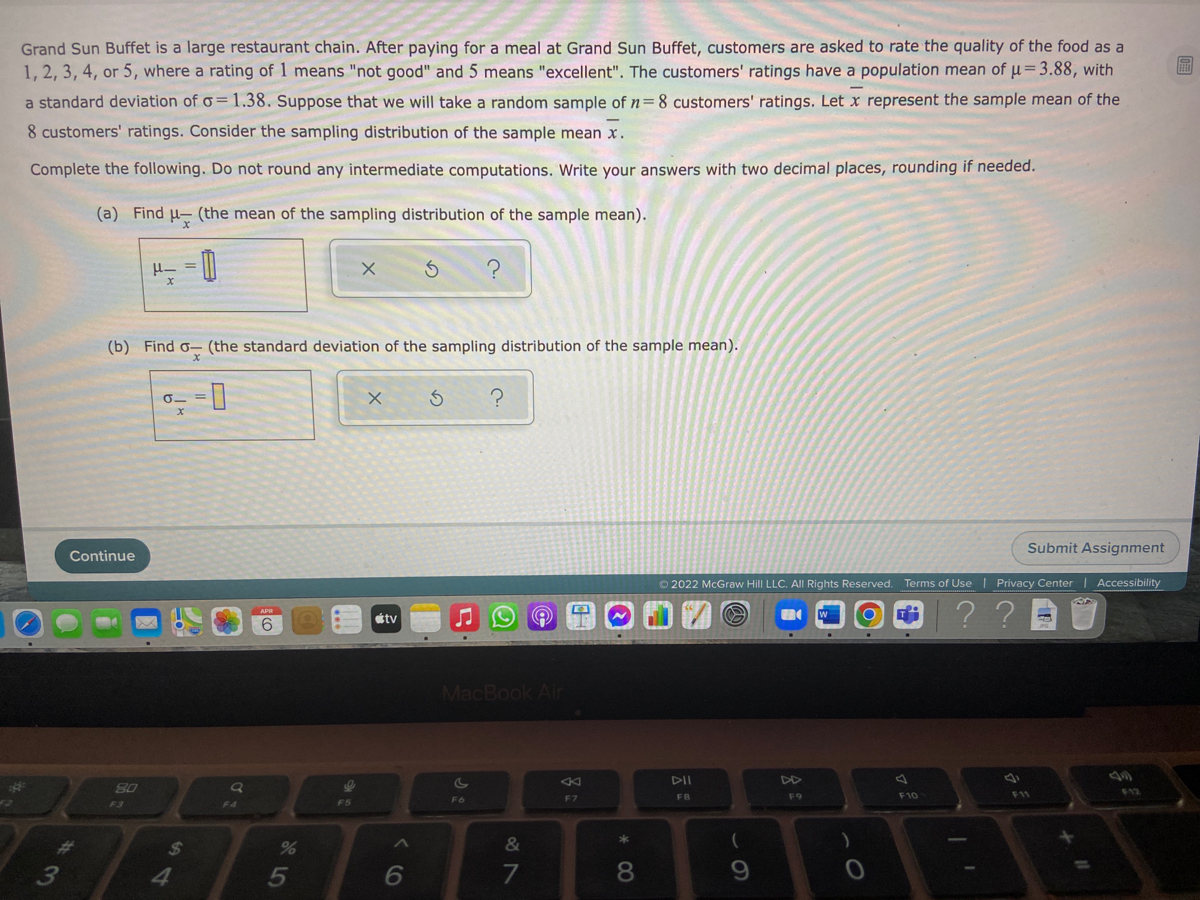

Transcribed Image Text:Grand Sun Buffet is a large restaurant chain. After paying for a meal at Grand Sun Buffet, customers are asked to rate the quality of the food as a
1, 2, 3, 4, or 5, where a rating of 1 means "not good" and 5 means "excellent". The customers' ratings have a population mean of µ=3.88, with
a standard deviation of o=1.38. Suppose that we will take a random sample of n=8 customers' ratings. Let x represent the sample mean of the
8 customers' ratings. Consider the sampling distribution of the sample mean x.
Complete the following. Do not round any intermediate computations. Write your answers with two decimal places, rounding if needed.
(a) Find H-
(the mean of the sampling distribution of the sample mean).
(b) Find o- (the standard deviation of the sampling distribution of the sample mean).
Submit Assignment
Continue
O 2022 McGraw Hill LLC. Al Rights Reserved. Terms of Use | Privacy Center | Accessibility
? ?
étv
6
MacBook Alr
DII
%23
80
F7
FB
F9
F10
F11
F3
F5
24
4.
5
7
8.
9.
* C0
Expert Solution
This question has been solved!
Explore an expertly crafted, step-by-step solution for a thorough understanding of key concepts.

This is a popular solution

Trending nowThis is a popular solution!

Step by stepSolved in 2 steps with 2 images

Knowledge Booster

Similar questions
- An immunologist wants to compare two rabies vaccines. People who had previously received the vaccine were divided into two groups. The first group received a booster dose of type I vaccine and the second group received a booster dose of type II vaccine. Two weeks later the antibody level was measured. The average number of antibodies in each group appears in the following table: Do these data indicate that there is a difference in the effectiveness of the two vaccines used for booster doses? Assume a normal distribution and equal population variances. What type of hypothesis test will allow us to reach a conclusion in the situation posed above? A. Variance test B. Unilateral for difference in proportions C. Bilateral for average difference D. Unilateral for change in effectivenessarrow_forwardA hypertension trial is mounted, and 12 participants are randomly assigned to receive either a new medication or a placebo. Each participant takes the assigned medication, and the participants’ SBP is recorded after 6 months on the assigned medication. The data are shown in Table 7–9. Is there a difference in mean SBP between treatments? Run the appropriate test at a = 0.05. Placebo New Medication 134 114 143 117 148 121 142 124 150 122 160 128arrow_forwardPart I A bakery sells homemade bread by the loaf and sales are uniformly distributed between 200 and 600 loaves per day. a. Find the probability of selling 240 loaves on a given day. b. Find the probability of selling between 250 and 260 loaves per day Part II The golf balls produced by TruGolf have a mean distance of 250 meters and a variance of 625 meters. c. How large a sample of TruGolf balls should be taken if they want to estimate with 90% confidence the mean distance to within 8 meters? d A random sample of 40 balls from TruGolf are selected. Find the Bound of Error when the confidence level is 95% for TruGolfarrow_forward
- A recent Gallup Poll interviewed a random sample of 1523 adults. Of these, 868 bought a lottery tickets in the past year. Suppose that in fact (unknown to Gallup) exactly 60% of all adults bought a lottery ticket in the past year. If Gallup took many simple random samples of 1,523 people, the sample proportion who bought a ticket would vary from sample to sample. The sampling distribution would be close to normal with a mean of 0.6 and a standard deviation of___ A)0.4899 B)0.0251 C)0.00016 D)0.0126arrow_forwardW Listed below are the measured radiation rates in corresponding to these cell phones: iPhone X, kg HTC Desire 310, LG G3, Motorola VE465, OnePlus 5, and Samsung Galaxy S8. The data are from the Federal Communications Commission. Find the range, variance, and standard deviation for the given sample data. Are any of the resulting statistics helpful in selecting a cell phone for purchase? 0.97 0.65 0.48 1.09 1.37 1.52 O The range is (Type an integer or decimal rounded to three decimal places as needed.)arrow_forward. Each member of a large genetics class grows 12 pea plants from an independent pea family. Each family is expected to have 3/4 plants with smooth peas and 1/4 plants with wrinkled peas. a. On average, how many wrinkled pea plants will a student see in her 12 plants? b. What is the standard deviation of the proportion of wrinkled pea plants per student? c. What is the variance of the proportion of wrinkled pea plants per student? d. Predict what proportion of the students saw exactly two wrinkled pea plants in their sample.arrow_forward
- A researcher would like to evaluate the effectiveness of a pain-relief patch designed for back pain. Prior to testing the patch, each of n = 8 patients rates their current level of back pain on a scale from 1 to 10. After wearing the patch for 90 minutes, a second pain rating is recorded. The data are as follows: Before After 6 2 8 3 9 4 8 1 10 2 5 3 9 8 7 7 a. Compute the mean and variance for the sample of difference scores. b. Do the results indicate that the pain-relief patch has an effect? Use a two-tailed test with α = .05 c. Compute Cohen’s d to measure the size of the effect.arrow_forwardA study is done to determine if students in the California state university (CSU) system take longer to graduate, on average, than students enrolled in private universities using the significant level of 5%. One hundred students from both the California state university system and private universities are surveyed. Suppose that from years of research, it is known that the population standard deviations are 1.5811 years for CSU and 1 year for private universities. The following data are collected. The California state university system students took on average 4.5 years with a standard deviation of 0.8. The private university students took on average 4.1 years with a standard deviation of 0.3. What is the decision rule of rejecting the null hypothesisarrow_forward
arrow_back_ios
arrow_forward_ios
Recommended textbooks for you
- A First Course in Probability (10th Edition)ProbabilityISBN:9780134753119Author:Sheldon RossPublisher:PEARSON

A First Course in Probability (10th Edition)
Probability
ISBN:9780134753119
Author:Sheldon Ross
Publisher:PEARSON