MATLAB: An Introduction with Applications
6th Edition
ISBN: 9781119256830
Author: Amos Gilat
Publisher: John Wiley & Sons Inc
expand_more
expand_more
format_list_bulleted
Question

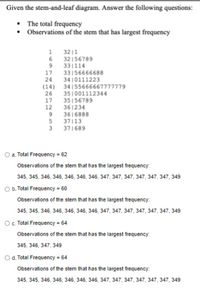
Transcribed Image Text:Given the stem-and-leaf diagram. Answer the following questions:
• The total frequency
• Observations of the stem that has largest frequency
32 |1
6.
32156789
331114
33156666688
3410111223
34 155666667777779
351001112344
35156789
361234
9.
17
(14)
26
17
12
3616888
37|13
371689
O a. Total Frequency = 62
Observations of the stem that has the largest frequency:
345, 345, 346, 346, 346, 346, 346, 347, 347, 347, 347, 347, 347, 349
O b. Total Frequency = 60
Observations of the stem that has the largest frequency:
345, 345, 346, 346, 346, 346, 346, 347, 347, 347, 347, 347, 347, 349
O. Total Frequency 64
Observations of the stem that has the largest frequency:
345, 346, 347, 349
O d. Total Frequency = 64
Observations of the stem that has the largest frequency:
345, 345, 346, 346, 346, 346, 346, 347, 347, 347, 347, 347, 347, 349
H21 21
Expert Solution
This question has been solved!
Explore an expertly crafted, step-by-step solution for a thorough understanding of key concepts.
Step by stepSolved in 3 steps

Knowledge Booster
Similar questions
- A geographer studying West Africa would like to know the size of stones in the delta region where the Niger River runs into the Gulf of Guinea. He collects 53 stones and measures the diameter of each, and so obtains the following measurements, in centimeters as seen below in the frequency table. Size (cm) Frequency [0, 2) [2, 4) 17 13 [4, 6) [6, 8) [8, 10) [10, 12) 10 7 4 a. Create a histogram for the measured stones. Include all labels. b. How many stones are larger than or equal to 6 cm?arrow_forwardBelow are the times (in days) it takes for a sample of 22 customers from Jack's computer store to pay their invoices. 19, 15, 43, 39, 35, 31, 27, 22, 18, 14, 42, 38, 13, 13, 41, 41, 37, 37, 37, 33, 33, 33 Send data to calculator Draw the frequency polygon for these data using an initial class boundary of 12.5 and a class width of 7. Note that you can add or remove classes from the figure. Label each class with its midpoint. Frequency 7. Check 26°F Clear Q Search 0:00 00:0 X Save For Later C Submit Assignmearrow_forwardAfter recording the final grade (A, B, C, D, E) for each individual in a class of n = 26 students, the professor would like to display the grade distribution in a frequency distribution graph. What kind of graph should be used? Question 15 options: A bar graph A histogram A polygon Either a histogram or a polygonarrow_forward
- The given data represent the number of people from a town, aged 25-64, who subscribe to a certain print magazine. Construct a frequency polygon. Does the graph suggest that the distribution is skewed? If so, how? Age Реople 25-34 53 35-44 238 45-54 743 55-64 687 Construct a frequency polygon using the data. Choose the correct graph below. O A. В. D. Frequency Frequency Frequency Frequency 1000- 1000- 1000- 1000- 0- 25 0 25 65 19.5 69.5 19.5 69.5 65 Age Age Age Agearrow_forward1. What information should be present in a frequency table and why?arrow_forward
arrow_back_ios
arrow_forward_ios
Recommended textbooks for you
 MATLAB: An Introduction with ApplicationsStatisticsISBN:9781119256830Author:Amos GilatPublisher:John Wiley & Sons Inc
 Probability and Statistics for Engineering and th...StatisticsISBN:9781305251809Author:Jay L. DevorePublisher:Cengage Learning
 Statistics for The Behavioral Sciences (MindTap C...StatisticsISBN:9781305504912Author:Frederick J Gravetter, Larry B. WallnauPublisher:Cengage Learning
 Elementary Statistics: Picturing the World (7th E...StatisticsISBN:9780134683416Author:Ron Larson, Betsy FarberPublisher:PEARSON
 The Basic Practice of StatisticsStatisticsISBN:9781319042578Author:David S. Moore, William I. Notz, Michael A. FlignerPublisher:W. H. Freeman
 Introduction to the Practice of StatisticsStatisticsISBN:9781319013387Author:David S. Moore, George P. McCabe, Bruce A. CraigPublisher:W. H. Freeman

MATLAB: An Introduction with Applications
Statistics
ISBN:9781119256830
Author:Amos Gilat
Publisher:John Wiley & Sons Inc

Probability and Statistics for Engineering and th...
Statistics
ISBN:9781305251809
Author:Jay L. Devore
Publisher:Cengage Learning

Statistics for The Behavioral Sciences (MindTap C...
Statistics
ISBN:9781305504912
Author:Frederick J Gravetter, Larry B. Wallnau
Publisher:Cengage Learning

Elementary Statistics: Picturing the World (7th E...
Statistics
ISBN:9780134683416
Author:Ron Larson, Betsy Farber
Publisher:PEARSON

The Basic Practice of Statistics
Statistics
ISBN:9781319042578
Author:David S. Moore, William I. Notz, Michael A. Fligner
Publisher:W. H. Freeman

Introduction to the Practice of Statistics
Statistics
ISBN:9781319013387
Author:David S. Moore, George P. McCabe, Bruce A. Craig
Publisher:W. H. Freeman