
ENGR.ECONOMIC ANALYSIS
14th Edition
ISBN: 9780190931919
Author: NEWNAN
Publisher: Oxford University Press
expand_more
expand_more
format_list_bulleted
Related questions
Question
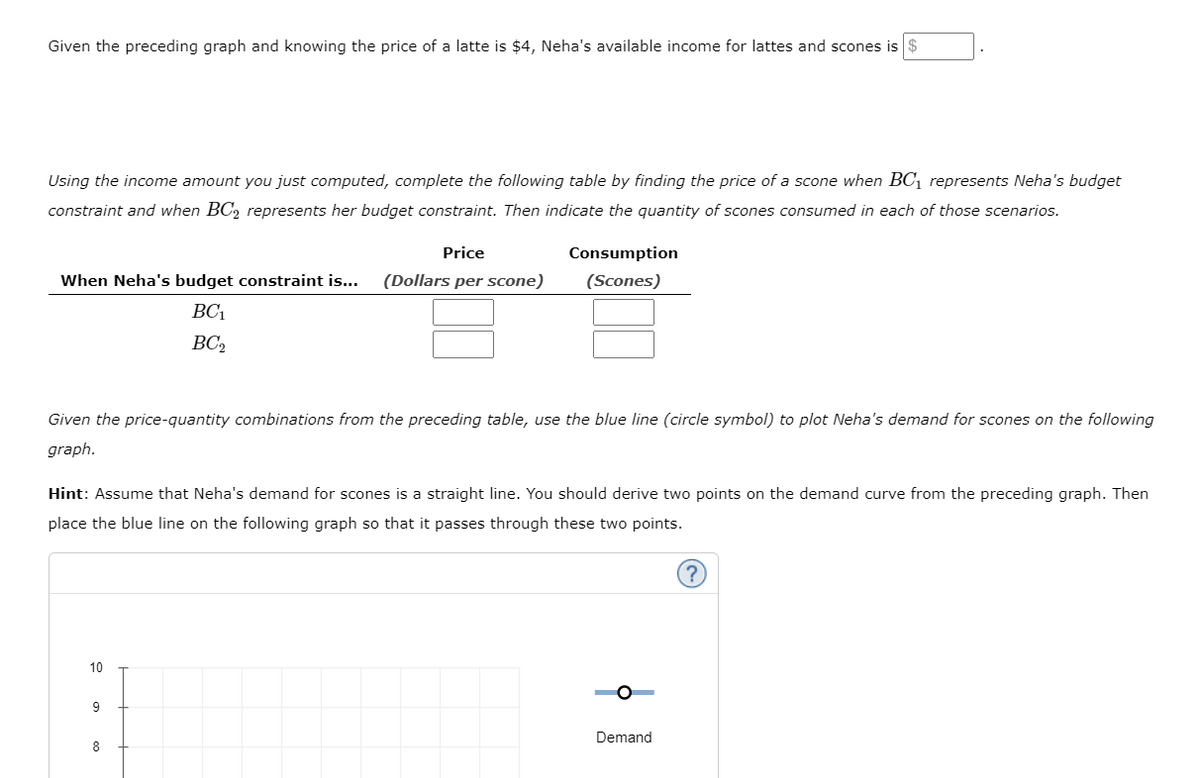

Transcribed Image Text:Given the preceding graph and knowing the price of a latte is $4, Neha's available income for lattes and scones is $
Using the income amount you just computed, complete the following table by finding the price of a scone when BC, represents Neha's budget
constraint and when BC, represents her budget constraint. Then indicate the quantity of scones consumed in each of those scenarios.
Price
Consumption
When Neha's budget constraint is...
(Dollars per scone)
(Scones)
BC1
BC,
Given the price-quantity combinations from the preceding table, use the blue line (circle symbol) to plot Neha's demand for scones on the following
graph.
Hint: Assume that Neha's demand for scones is a straight line. You should derive two points on the demand curve from the preceding graph. Then
place the blue line on the following graph so that it passes through these two points.
10
9
Demand
8

Transcribed Image Text:Neha lives in San Diego and enjoys drinking lattes and eating scones. The price of a latte is held constant at $4 throughout this problem.
On the following graph, the purple curves (I and I2) represent two of Neha's indifference curves. The lines BC, and BC2 show two budget
constraints. Points X and Y show Neha's optimum consumption bundles subject to these budget constraints.
20
18
16
14
12
10
8
6.
4
BO
BC
2
4
8
10
12
14
16
18
20
SCONES
LATTES
Expert Solution
This question has been solved!
Explore an expertly crafted, step-by-step solution for a thorough understanding of key concepts.

This is a popular solution

Trending nowThis is a popular solution!

Step by stepSolved in 3 steps with 1 images

Knowledge Booster

Similar questions
- Lucas has $40 per week that he can spend on lemon soda (X) and chips (Y). The price of the lemon soda (PX) is $2 per bottle, and the price of the chips (PY) is $4 price Write down Lucas’s budget constraint. Draw the budget constraint on the graph below. Make sure to indicate the intercepts and the slope of budget constraint. Label it as BC1. Provide an economic interpretation of the slope of the budget constraint BC1 Suppose Lucas’s income decreases to $12 per week, and the price of lemon soda and chips remain the same. Write down Lucas’s new budget constraint. Then draw his new budget constraint on the same graph above. Make sure to indicate the intercepts and the slope. Label it as BC2. Suppose Lucas’s income remains to be $40 per week and the price of chips remains the same, but the price of lemon soda (PX) increases to $5. Write down Lucas’s new budget constraint. Then draw his new budget constraint on the same graph above. Make sure to indicate the intercepts and the…arrow_forward1) Max chooses to purchase movie tickets and restaurant meals every week with his $100. If the price of a movie ticket is $20 and the price of a restaurant meal is $25, then the slope of his budget constraint will be, a) 1/5 b) -1/5 c) 4/5 d) -4/5 2) Marginal rate of substitution(MRS) is the rate at which consumer is willing to trade one good for another. It must be true that: a) MRS is the slope of an indifference curve in reference to a particular bundle of goods. b) MRS is not the same along an indifference curve that is of usual shape. c) MRS is same along an indifference curve that is of usual shape. d) Both a) and b).arrow_forwardSuppose Lorenzo has a weekly budget of $48 to spend on ranch dressing and peanut butter. Ranch dressing is priced at $4 per bottle, and peanut butter is priced at $6 per jar. If Lorenzo spends his entire $48 on ranch dressing, he can buy jars of peanut butter. buy Use the blue line (circle symbol) to plot Lorenzo's budget constraint on the following graph. Next, use the orange point (square symbol) to shade the area that represents combinations of ranch dressing and peanut butter that are affordable for Lorenzo. Finally, place the black point (plus symbol) on the point on Lorenzo's budget constraint that corresponds to a scenario in which Lorenzo spends $24 on each good. Note: Dashed drop lines will automatically extend to both axes. PEANUT BUTTER (Jars) 24 22 20 18 2 0 + 0 2 4 12 14 16 18 20 22 bottles of ranch dressing. If he spends his entire $48 on peanut butter, he can 6 8 RANCH DRESSING (Bottles) O True False BC, ($48) O Affordable Region $24 on Each What does the slope of…arrow_forward
- O 0 (2 18 8. Normal and inferior goods Megan likes going to the ballpark to watch baseball, and she also is fond of going to the theater to listen to the symphony orchestra. The following diagram shows two of Megan's indifference curves for going to ballgames and symphonies. With Megan's initial budget constraint (BC), she chose to go to five symphonies and three baseball games per month (point X). Then her budget constraint shifted to BC, and she chose to go to four symphonies and six ballgames per month (point Y), SEOTING 2 4 SYMPHONIES BCarrow_forwardpats >125 per week to spend on peanut butter and carrots in the fixed ratio of 1 pound of peanut butter to 4 pounds of carrots. Peanut butter costs $1 per pound and carrots cost $0.5 per pound Suppose the price of carrots were to rise from $05 to $1 per pound. By how much will Tom have to reduce his consumption of carrotsarrow_forward8. Fabian consumes X and Y and the following utility function represents his utility: U = 2XY a. With a utility function of U = 2XY, Fabian's MU, = 2Y and his MU, = 2x ,where MU is marginal utility. Write an equation for Fabian's marginal rate of substitution (MRS). b. Suppose Fabian's income is $120 and Px = S6 and Py-$2, where Px is the price of X and Py is the price of Y. Write an equation for Fabian's budget constraint. c. Write the equation that equates the slope of Fabian's budget constraint to the slope of Fabian's indifference curve: d. If Fabian is spending all of his income, how much X and how much Y will he choose? Use the equations you wrote in part's b and c to answer this question. e. What will Fabian's utility be with this combination of X and Y? f. Now suppose the price of X increases to P.=10. Write the equation that equates the slope of Fabian's budget constraint to the slope of Fabian's indifference curve. How will this change the optimal combination of X and Y? What…arrow_forward
- Suppose Sam has a weekly budget of $48 to spend on juice and yogurt. Juice is priced at $4 per gallon, and yogurt is priced at $2 per container. gallons of juice. If he spends his entire $48 on yogurt, he can buy containers of If Sam spends his entire $48 on juice, he can buy yogurt. Use the blue line (circle symbol) to plot Sam's budget constraint on the following graph. Next, use the orange point (square symbol) to shade the area that represents combinations of juice and yogurt that are affordable for Sam. Finally, place the black point (plus symbol) on the point on Sam's budget constraint that corresponds to a scenario in which Sam spends $24 on each good. Note: Dashed drop lines will automatically extend to both axes. ? 36 33 30 27 24 21 18 12 9 6 3 YOGURT (Containers) 0 0 + 3 6 9 12 15 18 21 JUICE (Gallons) 24 27 30 33 36 BC, ($48) 0 Affordable Region $24 on Each BC₂ ($60)arrow_forwardQuestion 4 Naomi's expenditure function defined for a month for two commodities, Cassava (Q₁) and Banana (Q₂) is given by: 1. 11. Where P₁ is the price of Cassava (P₁>0), P2 is the price of banana (P₂ >0) and U is the fixed utility. The income of Naomi is m, where m > 0. Derive the indirect utility function for Naomi (Hint: Use the duality conditions) Using the Shephard's Lemma condition, derive Naomi's Hicksian demand function for Cassava (Q₁). iii. H IV. [125P,PU3 8 Using the Roy's identity, derive Naomi's Marshallian demand function for Banana (Q₂). Using the answer in (i), evaluate Naomi's maximum utility level when the price per tuber of Cassava is 5 cedis, the price per finger of banana is 10 cedis and her income is 250 cedis.arrow_forwardJohn has $300 as income and he uses his income only for apples and bananas. If he uses his income only for apples, he can buy 10 pounds. If he uses his income only for bananas, he can buy 15 pounds. Which one is the correct formula for his budget constraint when X=pounds of apples, Y=pounds of bananas and the prices are per pound? a) More information is needed to answer the question. b) 15X + 10Y = 300 c) 10X + 15Y = 300 d) 20X + 30Y = 300 e) 30X + 20Y = 300arrow_forward
arrow_back_ios
arrow_forward_ios
Recommended textbooks for you
 Principles of Economics (12th Edition)EconomicsISBN:9780134078779Author:Karl E. Case, Ray C. Fair, Sharon E. OsterPublisher:PEARSON
 Engineering Economy (17th Edition)EconomicsISBN:9780134870069Author:William G. Sullivan, Elin M. Wicks, C. Patrick KoellingPublisher:PEARSON
 Principles of Economics (MindTap Course List)EconomicsISBN:9781305585126Author:N. Gregory MankiwPublisher:Cengage Learning
 Managerial Economics: A Problem Solving ApproachEconomicsISBN:9781337106665Author:Luke M. Froeb, Brian T. McCann, Michael R. Ward, Mike ShorPublisher:Cengage Learning
 Managerial Economics & Business Strategy (Mcgraw-...EconomicsISBN:9781259290619Author:Michael Baye, Jeff PrincePublisher:McGraw-Hill Education
Principles of Economics (12th Edition)
Economics
ISBN:9780134078779
Author:Karl E. Case, Ray C. Fair, Sharon E. Oster
Publisher:PEARSON
Engineering Economy (17th Edition)
Economics
ISBN:9780134870069
Author:William G. Sullivan, Elin M. Wicks, C. Patrick Koelling
Publisher:PEARSON
Principles of Economics (MindTap Course List)
Economics
ISBN:9781305585126
Author:N. Gregory Mankiw
Publisher:Cengage Learning
Managerial Economics: A Problem Solving Approach
Economics
ISBN:9781337106665
Author:Luke M. Froeb, Brian T. McCann, Michael R. Ward, Mike Shor
Publisher:Cengage Learning
Managerial Economics & Business Strategy (Mcgraw-...
Economics
ISBN:9781259290619
Author:Michael Baye, Jeff Prince
Publisher:McGraw-Hill Education