
MATLAB: An Introduction with Applications
6th Edition
ISBN: 9781119256830
Author: Amos Gilat
Publisher: John Wiley & Sons Inc
expand_more
expand_more
format_list_bulleted
Related questions
Question
Given the information provided, need help describing the type of association between Area and SpineL. Thank you :)
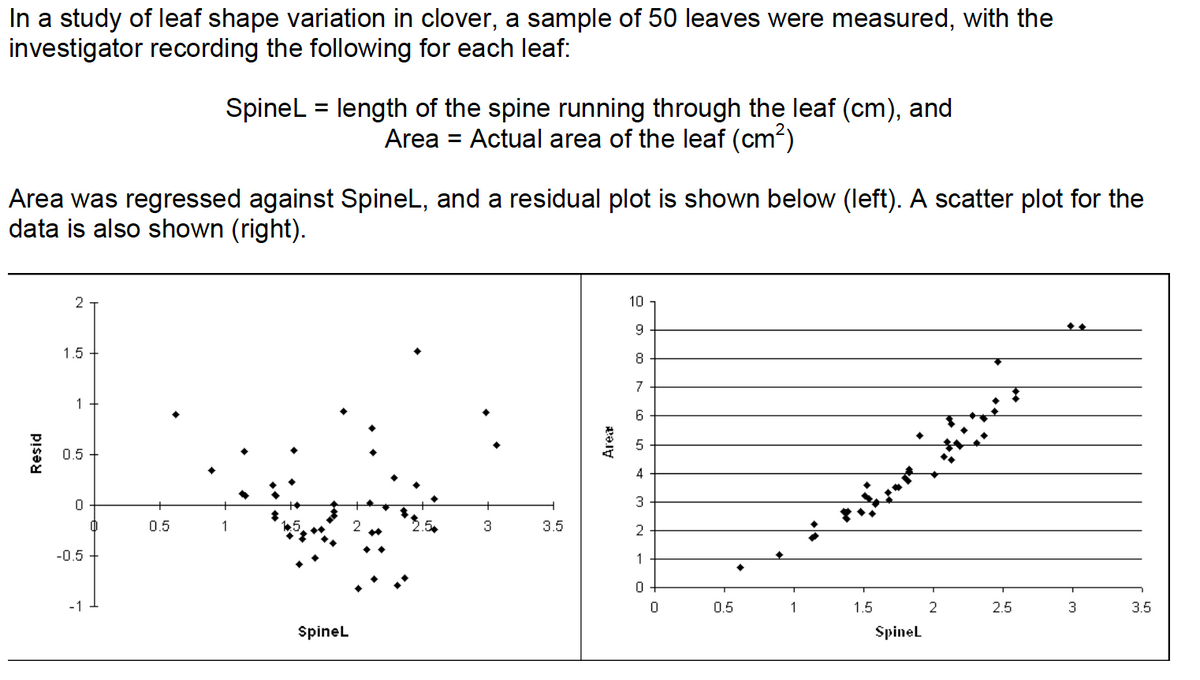

Transcribed Image Text:In a study of leaf shape variation in clover, a sample of 50 leaves were measured, with the
investigator recording the following for each leaf:
Area was regressed against SpineL, and a residual plot is shown below (left). A scatter plot for the
data is also shown (right).
Resid
2
1.5
1
0.5
0
-0.5
-1
0
SpineL = length of the spine running through the leaf (cm), and
Area = Actual area of the leaf (cm²)
0.5
SpineL
3
3.5
Area
10
9
8
7
6
5
4
3
2
1
0
0
0.5
1
1.5
SpineL
2
2.5
3
3.5
Expert Solution
This question has been solved!
Explore an expertly crafted, step-by-step solution for a thorough understanding of key concepts.

Step by stepSolved in 2 steps

Knowledge Booster

Similar questions
- PLA)=0.62 PLB)こo.62 P(BUA)=0.85 ニo,arrow_forwardI have an area of similar polygons question.arrow_forward1. a) 5% b) 50% c) one fifth of 1% 2. a) z = 1.96 and z = -1.96 b) z = 2.58 and z = -2.58 c) z = 3.29 and z = -3.29 3. a) the area between the scores b) the area in the tails beyond each score 4. a) z = 2.58 and z = -2.58 b) z = 1.96 and z = -1.96 c) z = 3.29 and z = -3.29 5. a) not in b) in 6. a) cannot b) can 7. a) can b) cannotarrow_forward
- please look at the image for the following hmwkr question and not the transcribed text.arrow_forwardplease quickly thanks !arrow_forwardThe arrows can only be dragged to z scores that are accurate to 1 place after the decimal point (these values correspond to the tick marks on the horizontal axis). Select from the drop down menu to shade to the left, to the right, between or left and right of the z-score. a) Sketch the region corresponding to the statement �(�>1.6). Shade: . Click and drag the arrows to adjust the values. b) Find �(�>1.6) (Round answer to 4 decimal places.) please draw graph correctly because i have trouble with thosearrow_forward
arrow_back_ios
arrow_forward_ios
Recommended textbooks for you
- MATLAB: An Introduction with ApplicationsStatisticsISBN:9781119256830Author:Amos GilatPublisher:John Wiley & Sons Inc
 Probability and Statistics for Engineering and th...StatisticsISBN:9781305251809Author:Jay L. DevorePublisher:Cengage Learning
 Statistics for The Behavioral Sciences (MindTap C...StatisticsISBN:9781305504912Author:Frederick J Gravetter, Larry B. WallnauPublisher:Cengage Learning
  Elementary Statistics: Picturing the World (7th E...StatisticsISBN:9780134683416Author:Ron Larson, Betsy FarberPublisher:PEARSON
 The Basic Practice of StatisticsStatisticsISBN:9781319042578Author:David S. Moore, William I. Notz, Michael A. FlignerPublisher:W. H. Freeman
 Introduction to the Practice of StatisticsStatisticsISBN:9781319013387Author:David S. Moore, George P. McCabe, Bruce A. CraigPublisher:W. H. Freeman
MATLAB: An Introduction with Applications
Statistics
ISBN:9781119256830
Author:Amos Gilat
Publisher:John Wiley & Sons Inc
Probability and Statistics for Engineering and th...
Statistics
ISBN:9781305251809
Author:Jay L. Devore
Publisher:Cengage Learning
Statistics for The Behavioral Sciences (MindTap C...
Statistics
ISBN:9781305504912
Author:Frederick J Gravetter, Larry B. Wallnau
Publisher:Cengage Learning
Elementary Statistics: Picturing the World (7th E...
Statistics
ISBN:9780134683416
Author:Ron Larson, Betsy Farber
Publisher:PEARSON
The Basic Practice of Statistics
Statistics
ISBN:9781319042578
Author:David S. Moore, William I. Notz, Michael A. Fligner
Publisher:W. H. Freeman
Introduction to the Practice of Statistics
Statistics
ISBN:9781319013387
Author:David S. Moore, George P. McCabe, Bruce A. Craig
Publisher:W. H. Freeman