
Big Ideas Math A Bridge To Success Algebra 1: Student Edition 2015
1st Edition
ISBN: 9781680331141
Author: HOUGHTON MIFFLIN HARCOURT
Publisher: Houghton Mifflin Harcourt
expand_more
expand_more
format_list_bulleted
Related questions
Question
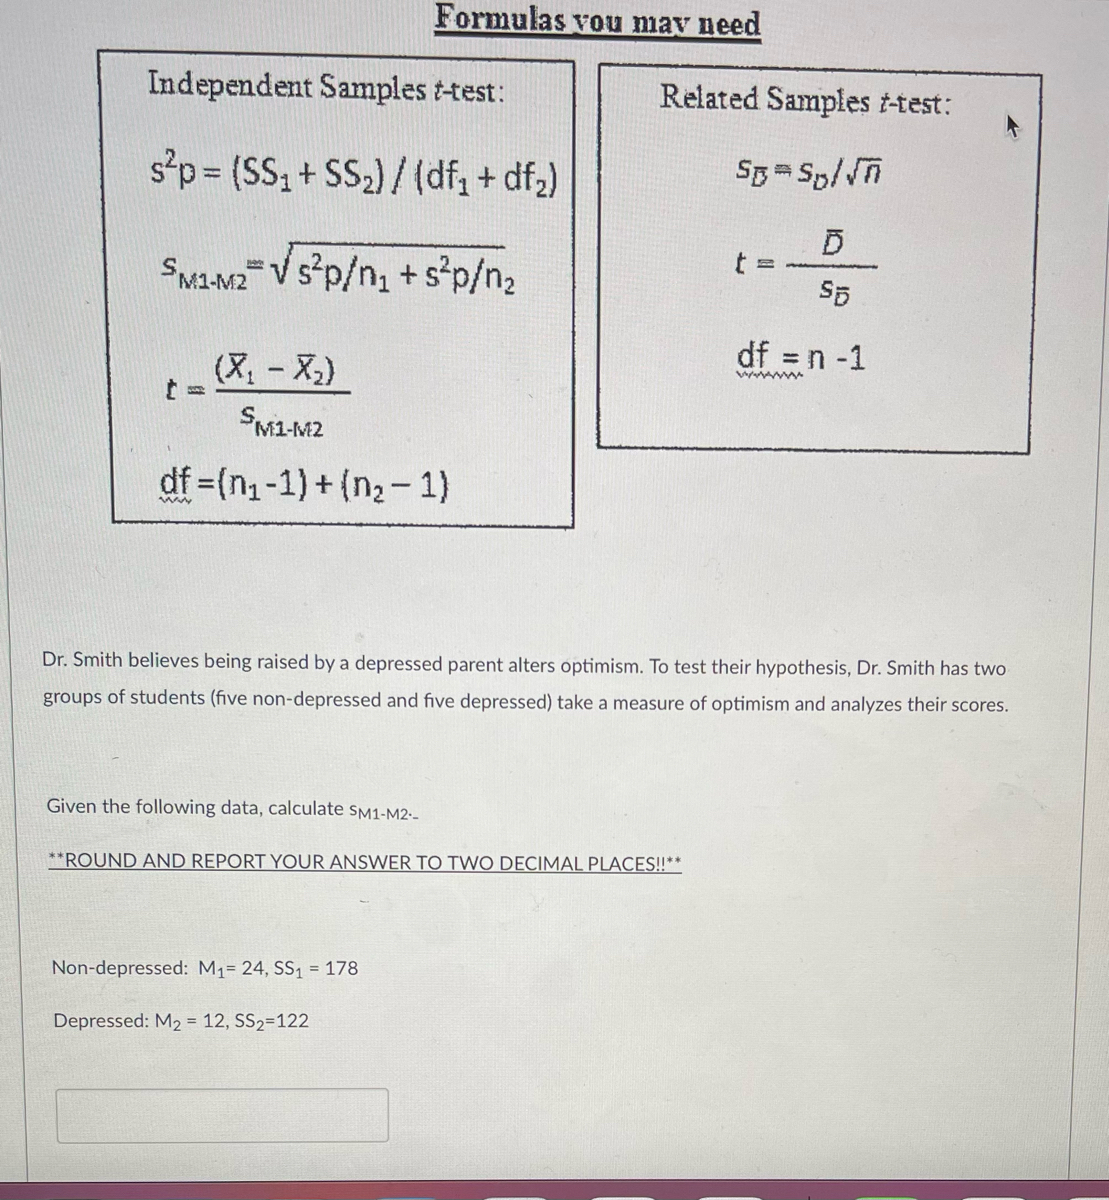

Transcribed Image Text:Independent Samples t-test:
s²p = (SS₁ + SS₂)/(df₁ + df₂)
SM1-M2 Vs²p/n₁ + s²p/n₂
(x₁ - X₂)
SM1-M2
df=(n₁-1)+(n₂-1)
Formulas vou may need
Given the following data, calculate SM1-M2--
Related Samples t-test:
Sp=So/√n
D
S5
Non-depressed: M₁= 24, SS₁ = 178
Depressed: M₂ = 12, SS₂-122
Dr. Smith believes being raised by a depressed parent alters optimism. To test their hypothesis, Dr. Smith has two
groups of students (five non-depressed and five depressed) take a measure of optimism and analyzes their scores.
**ROUND AND REPORT YOUR ANSWER TO TWO DECIMAL PLACES!!**
t =
df = n -1
wwwww

Transcribed Image Text:TABLE A.3 Critical Values for the Student's t Distribution
df
1
2
3
4
5
6
7
8
9
10
11
12
13
14
15
16
17
18
19
20
21
22
23
24
25
26
27
28
29
30
40
60
120
00
.10
.20
3.078
1.886
1.638
1.533
1.476
1.440
1.415
1.397
1.383
1.372
1.363
1.356
1.350
1.345
1.341
1.337
1.333
1.330
1.328
1.325
1.323
1.321
1.319
1.318
1.316
1.315
1.314
1.313
1.311
1.310
1.303
1.296
1.289
1.282
.05
.10
6.314
2.920
2.353
2.132
2.015
1.943
1.895
1.860
1.833
1.812
1.796
1.782
1.771
1.761
1.753
1.746
1.740
1.734
1.729
1.725
1.721
1.717
1.714
1.711
1.708
1.706
1.703
1.701
1.699
1.697
1.684
1.671
1.658
1.645
Level of Significance for One-Tailed Test
.025
.01
Level of Significance for Two-Tailed Test
.02
31.821
6.965
4.541
.05
12.706
4.303
3.182
2.776
2.571
2.447
2.365
2.306
2.262
2.228
2.201
2.179
2.160
2.145
2.131
2.120
2.110
2.101
2.093
2.086
2.080
2.074
2.069
2.064
2.060
2.056
2.052
2.048
2.045
2.042
2.021
2.000
1.980
1.960
3.747
3.365
3.143
2.998
2.896
2.821
2.764
2.718
2.681
2.650
2.624
2.602
2.583
2.567
2.552
2.539
2.528
2.518
2.508
2.500
2.492
2.485
2.479
2.473
2.467
2.462
2.457
2.423
2.390
2.358
2.326
.005
VENTER
.01
63.657
9.925
5.841
4.604
4.032
3.707
3.499
3.355
3.250
3.169
3.106
3.055
3.012
2.977
2.947
2.921
2.898
2.878
2.861
2.845
2.831
2.819
2.807
2.797
2.787
2.779
2.771
2.763
2.756
2.750
2.704
2.660
2.617
2.576
.0005
.001
636.619
31.598
12.941
8.610
6.859
5.959
5.405
5.041
4.781
4.587
4.437
4.318
4.221
4.140
4.073
4.015
3.965
3.922
3.883
3.850
3.819
3.792
3.767
3.745
3.725
3.707
3.690
3.674
3.659
3.646
3.551
3.460
3.373
3.291
SOURCE: Lehman, R. S. (1995) Statistics in the Behavioral Sciences: A Conceptual Introduction. Pacific Grove, CA: Brooks/Cole Publishing.
Reprinted by permission of the author.
Expert Solution
This question has been solved!
Explore an expertly crafted, step-by-step solution for a thorough understanding of key concepts.

This is a popular solution

Trending nowThis is a popular solution!

Step by stepSolved in 3 steps with 5 images

Knowledge Booster

Similar questions
- last question submitted in error, here is the full question with both partsarrow_forwardGive a brief analysis of the following cross 2?arrow_forwardStrength of concrete: The compressive strength, in kilopascals, was measured for concrete blocks from five different batches of concrete, both three and six days after pouring. The data are as follows. Can you conclude that the mean strength after three days differs from the mean strength after six days? Let μ1 represent the mean strength after three days and =μd−μ1μ2 . Use the =α0.10 level and the P -value method with the table. Block 1 2 3 4 5 After 3 days 1356 1337 1344 1310 1348 After 6 days 1352 1355 1355 1324 1380 State the appropriate null and alternate hypotheses. test statistic: Estimate the P-value. Identify the form of the interval based on the Critical Values for the Student's t Distribution Table. Determine whether to reject H0 State the conclusion: There enough evidence to conclude that the mean strength after three days differs from the mean strength after six days.arrow_forward
- Is there a statistically significant difference between professors and rock stars in terms of political party affiliation? The proportion of professors and rock stars registered as Democrats from a nationally representative sample from each profession is reported below. Please include all steps of the five step model and write a sentence or two interpreting your results (use p= .01, Z(critical) = ± 2.58). Professors Rock Stars Ps1 = .86 Ps2 = .92 N1 = 325 N2 = 287arrow_forwardA sample of 3 measurements are taken and recorded: x=7, y=10 and z=8 The sample mean is: x¯=x+y+z3=8.33 Fill in the table below. ai (ai−x¯)2 x y z s2=(x−x¯)2+(y−x¯)2+(z−x¯)22= s=(x−x¯)2+(y−x¯)2+(z−x¯)22=arrow_forwardJustify your conclusion in terms of the derivative of the parameter transformation involvedarrow_forward
- H0 : =150.00 kPa H1 :>150.00 kPa b) α= 0.01; sample variance : 1300 (freq. table ) sample deviation : 36.0555 (freq. table ) Calculation of Data Mean of the results= = 6700/50 =134 Mid Range of the results= (217.32+46.32)/2= 131.82 Range = (217.32-46.32) = 171 Modal Class= Class 121-145 with the highest frequency of 15 Median of the sorted set of data = 132.25 Mode = there are not clear modes In the samples. Sample variance S o= 1300 Sample deviation: S =36.55arrow_forwardA professor of mathematics teaches at a catholic school and at a public school. He wants to know whether attending a catholic school leads to higher grades. He collected data from 7,430 students from both school's types. Considering this information, please answer the following questions: a) How can you interpret the OLS outcome on whether the child attended a catholic school (cathhs) is important to explain students' grade? Source Model Residual Total cathhs lfaminc SS 143098.058 521610.985 motheduc fatheduc 664709.043 df math12 Coefficient Std. err. 17887.2573 8 7,421 70.2885036 7,429 89.4749015 1.623158 .4106669 1.447696 .1431147 .0613988 .7345401 .832485 . 055494 black -5.226717 hispan -1.221689 asian 3.28341 female _cons MS .3915981 .3328612 .4438741 -1.066021 .1950649 16.72931 1.355485 Number of obs F(8, 7421) Prob > F R-squared Adj R-squared Root MSE t P>|t| 3.95 0.000 0.000 10.12 11.96 0.000 15.00 0.000 -13.35 0.000 -3.67 0.000 7.40 0.000 -5.46 0.000 12.34 0.000 = .8181343…arrow_forwardotal plasma volume is important in determining the required plasma component in blood replacement therapy for a person undergoing surgery. Plasma volume is influenced by the overall health and physical activity of an individual. Suppose that a random sample of 46 male firefighters are tested and that they have a plasma volume sample mean of x = 37.5 ml/kg (milliliters plasma per kilogram body weight). Assume that ? = 7.50 ml/kg for the distribution of blood plasma. (a)Find a 99% confidence interval for the population mean blood plasma volume in male firefighters. What is the margin of error? (Round your answers to two decimal places.) lower limit ___ upper limit ___ margin of error ___ (b)What conditions are necessary for your calculations? (Select all that apply.) A-the distribution of volumes is uniform B-? is known C-the distribution of volumes is normal D-? is unknown E-n is large d)Find the sample size necessary for a 99% confidence level with maximal margin of error E =…arrow_forward
- An economic instructor at UCF is interested in the relationship between hours spent studying and total points earned in a course. Data collected on 19 students who took the course last semester follow # of observation(s) n = 19 # of independent variable(s) = 1 SSR = 3,882 SSE = 256 Find the Value for MSE (Use two decimals)arrow_forwardDetermine whether the samples are independent or consist of matched pairs. (a) A speed training method is tested by comparing the 100 m times of a group of sprinters who used this method with a group of sprinters who used a different method. F3 O independent samples O matched pairs (b) The amount of water that a random sample of families use per day is measured twice--once before they view a conservation video, and again one week after viewing this video. 4 O independent samples O matched pairs Submit Question R F4 % 5 T Ŝ F5 A Y F6 & 7 S U F7 * PrtScn 8 F8 Home ( F9 O ) End F10 P Farrow_forwardA single sample T-test is to be done on a study about typhoons. Many believe that the average number of typhoons that enter the Philippines each year is 18 (μ ≥ 18). Some climatologists, however, observe that the true average number of typhoons that enter the Philippines each year less than 18. Science teachers from LPU collected the data about the typhoons that entered the country each year since 2018 (n = 9). The sample mean is = 17. The sample standard deviation of s = 1.5. 32. State and Null and Alternative Hypotheses. 33. What is the level of confidence? 34. What is the critical value? Hint: You will find it in the table for T-Test. 35. Write the decision rule. 36. What is the equivalent T-score of x = 17? A. 1.5 B. 7.54 C. -2.00 D. 2.67 37. What is the conclusion to this problem after performing T-Test? STANDARD NORMAL TABLE (Z) Entries in the table give the area under the curve between the mean and z standard deviations above the mean. For example, for z= 1.25 the area under the…arrow_forward
arrow_back_ios
SEE MORE QUESTIONS
arrow_forward_ios
Recommended textbooks for you
- Big Ideas Math A Bridge To Success Algebra 1: Stu...AlgebraISBN:9781680331141Author:HOUGHTON MIFFLIN HARCOURTPublisher:Houghton Mifflin Harcourt
Big Ideas Math A Bridge To Success Algebra 1: Stu...
Algebra
ISBN:9781680331141
Author:HOUGHTON MIFFLIN HARCOURT
Publisher:Houghton Mifflin Harcourt