MATLAB: An Introduction with Applications
6th Edition
ISBN: 9781119256830
Author: Amos Gilat
Publisher: John Wiley & Sons Inc
expand_more
expand_more
format_list_bulleted
Concept explainers
Topic Video
Question
thumb_up100%

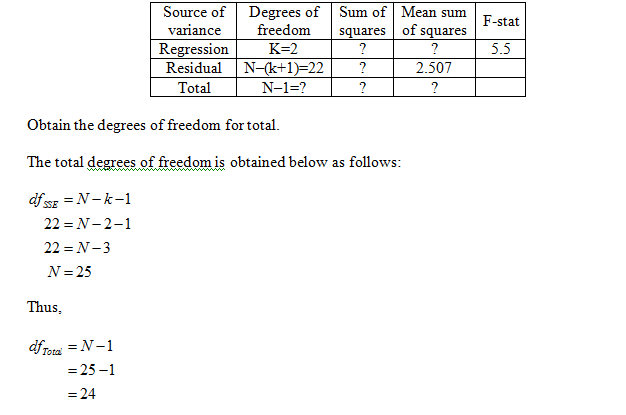
Transcribed Image Text:Given the following ANOVA table:
Degrees
Source of
of
Variance
Mean
Sum of
Sum of
F-stat
Squares
Freedom
Squares
Regression 2
5.5
Residual
22
2.507
Total
What is the value of R? Report your answer to 3 decimals.
Expert Solution
arrow_forward
Step 1
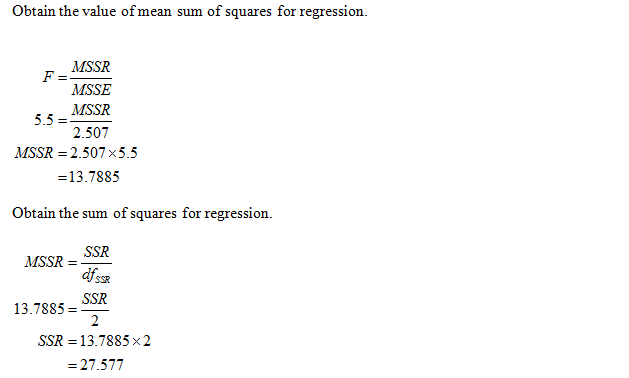
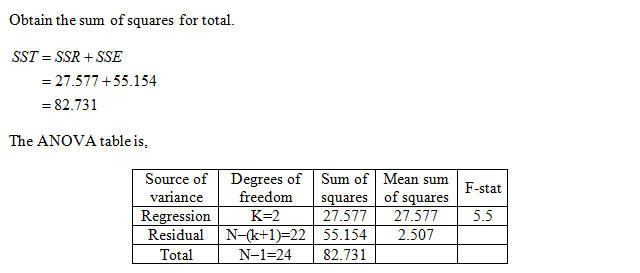
Obtain the missing values in the given ANOVA table.
The missing values in the given ANOVA table are obtained below as follows:
From the information, given that


Step by stepSolved in 2 steps with 5 images

Knowledge Booster
Learn more about
Need a deep-dive on the concept behind this application? Look no further. Learn more about this topic, statistics and related others by exploring similar questions and additional content below.Similar questions
- Use your knowledge about ANOVA tables and adjusted R-squared values to answer this question: As the sample size goes up, the average amount of variability explained (non-adjusted R-squared value) by a random (zero true predictive power) explanatory variable in regression: Group of answer choices goes down stays the same goes uparrow_forwardPlease answer question in imagearrow_forwardWhere are the deer? Random samples of square-kilometer plots were taken in different ecological locations of a national park. The deer counts per square kilometer were recorded and are shown in the following table. Mountain Brush Sagebrush Grassland Pinon Juniper 30 20 5 25 59 10 25 16 2 24 19 4 Shall we reject or accept the claim that there is no difference in the mean number of deer per square kilometer in these different ecological locations? Use a 5% level of significance. (a) What is the level of significance?State the null and alternate hypotheses. Ho: ?1 = ?2 = ?3; H1: Exactly two means are equal.Ho: ?1 = ?2 = ?3; H1: At least two means are equal. Ho: ?1 = ?2 = ?3; H1: All three means are different.Ho: ?1 = ?2 = ?3; H1: Not all the means are equal. (b) Find SSTOT, SSBET, and SSW and check that SSTOT = SSBET + SSW. (Use 3 decimal places.) SSTOT = SSBET = SSW = Find d.f.BET, d.f.W, MSBET, and MSW. (Use 2 decimal places for MSBET, and MSW.)…arrow_forward
- The second slide is the first part of the question and the first slide is the second part of the questionarrow_forwardIn a test of the difference between the two means below, what should the test value be for a t test? Sample mean Sample variance Sample size 0 -0.25 O -0.09 O -0.12 O-1.93 Sample 1 520 500 9 Sample 2 535 60 12arrow_forwardWhere are the deer? Random samples of square-kilometer plots were taken in different ecological locations of a national park. The deer counts per square kilometer were recorded and are shown in the following table. Mountain Brush Sagebrush Grassland Pinon Juniper 30 20 5 25 59 10 25 16 2 24 19 4 Shall we reject or accept the claim that there is no difference in the mean number of deer per square kilometer in these different ecological locations? Use a 5% level of significance. (a) What is the level of significance?State the null and alternate hypotheses. Ho: ?1 = ?2 = ?3; H1: Exactly two means are equal.Ho: ?1 = ?2 = ?3; H1: At least two means are equal. Ho: ?1 = ?2 = ?3; H1: All three means are different.Ho: ?1 = ?2 = ?3; H1: Not all the means are equal. (b) Find SSTOT, SSBET, and SSW and check that SSTOT = SSBET + SSW. (Use 3 decimal places.) SSTOT = SSBET = SSW = Find d.f.BET, d.f.W, MSBET, and MSW. (Use 2 decimal places for MSBET, and MSW.)…arrow_forward
- Where are the deer? Random samples of square-kilometer plots were taken in different ecological locations of a national park. The deer counts per square kilometer were recorded and are shown in the following table. Mountain Brush Sagebrush Grassland Pinon Juniper 35 17 2 30 53 6 20 19 2 26 19 8 Shall we reject or accept the claim that there is no difference in the mean number of deer per square kilometer in these different ecological locations? Use a 5% level of significance. (a) What is the level of significance? State the null and alternate hypotheses. Ho: μ1 = μ2 = μ3; H1: All three means are different.Ho: μ1 = μ2 = μ3; H1: Exactly two means are equal. Ho: μ1 = μ2 = μ3; H1: Not all the means are equal.Ho: μ1 = μ2 = μ3; H1: At least two means are equal. (b) Find SSTOT, SSBET, and SSW and check that SSTOT = SSBET + SSW. (Use 3 decimal places.) SSTOT = SSBET = SSW = Find d.f.BET, d.f.W, MSBET, and MSW. (Use 2 decimal places for MSBET, and MSW.)…arrow_forwardWhat are the values for SS and variance for the following sample of n = 3 scores? Sample: 8, 5, 2arrow_forwardwhat is the value in cell D? Round to 2 decimal places. How many total observations were there in the study? Hint: use df(total) to figure out the number of total observations. The following computer output is for an analysis of variance in which yields (bu/acre) of different varieties of oats were compared. Answer the following questions based on this ANOVA table. Source df SS MS F ratio Prob Between groups 2 76.90 38.45 D 0.63 Within groups 11 859.81 78.16 Total 13 936.17arrow_forward
- Given the following ANOVA table: Degrees Mean Source of of Variance Sum of Sum of F-stat Squares Freedom Squares | Regression 2 5.5 Residual 27 2.507 Total What is the value of SST? Please report your answer in 3 decimal places.arrow_forwardThe following table summarizes the results of a study on SAT prep courses, comparing SAT scores of students in a private preparation class, a high school preparation class, and no preparation class. Use the information from the table to answer the questions. Treatment # of observations Sample Mean Sum of Squares (SS) private prep 60 680 265,500 high school prep 60 650 276,120 no prep 60 635 302,670 Using the data provided, calculate the values needed for the ANOVA summary table. (Hint: T, the treatment total, can be calculated as the sample mean times the number of observations. G, the grand total, can be calculated from the values of T once you have calculated them.) Source Sum of Squares (SS) df Mean Squares (MS) between treatments within treatments The sum of squares between treatments is The sum of squares within treatments is The df between treatments is The df within treatments is The mean square between treatments is The mean square within treatments isarrow_forwardRefer to the ANOVA table for this regression. Source SS d.f. MS Regression 1,164,578 5 232,916 Residual 1,500,689 45 33,349 Total 2,665,267 50 (a) State the degrees of freedom for the F test for overall significance.arrow_forward
arrow_back_ios
SEE MORE QUESTIONS
arrow_forward_ios
Recommended textbooks for you
 MATLAB: An Introduction with ApplicationsStatisticsISBN:9781119256830Author:Amos GilatPublisher:John Wiley & Sons Inc
 Probability and Statistics for Engineering and th...StatisticsISBN:9781305251809Author:Jay L. DevorePublisher:Cengage Learning
 Statistics for The Behavioral Sciences (MindTap C...StatisticsISBN:9781305504912Author:Frederick J Gravetter, Larry B. WallnauPublisher:Cengage Learning
 Elementary Statistics: Picturing the World (7th E...StatisticsISBN:9780134683416Author:Ron Larson, Betsy FarberPublisher:PEARSON
 The Basic Practice of StatisticsStatisticsISBN:9781319042578Author:David S. Moore, William I. Notz, Michael A. FlignerPublisher:W. H. Freeman
 Introduction to the Practice of StatisticsStatisticsISBN:9781319013387Author:David S. Moore, George P. McCabe, Bruce A. CraigPublisher:W. H. Freeman

MATLAB: An Introduction with Applications
Statistics
ISBN:9781119256830
Author:Amos Gilat
Publisher:John Wiley & Sons Inc

Probability and Statistics for Engineering and th...
Statistics
ISBN:9781305251809
Author:Jay L. Devore
Publisher:Cengage Learning

Statistics for The Behavioral Sciences (MindTap C...
Statistics
ISBN:9781305504912
Author:Frederick J Gravetter, Larry B. Wallnau
Publisher:Cengage Learning

Elementary Statistics: Picturing the World (7th E...
Statistics
ISBN:9780134683416
Author:Ron Larson, Betsy Farber
Publisher:PEARSON

The Basic Practice of Statistics
Statistics
ISBN:9781319042578
Author:David S. Moore, William I. Notz, Michael A. Fligner
Publisher:W. H. Freeman

Introduction to the Practice of Statistics
Statistics
ISBN:9781319013387
Author:David S. Moore, George P. McCabe, Bruce A. Craig
Publisher:W. H. Freeman