MATLAB: An Introduction with Applications
6th Edition
ISBN: 9781119256830
Author: Amos Gilat
Publisher: John Wiley & Sons Inc
expand_more
expand_more
format_list_bulleted
Question

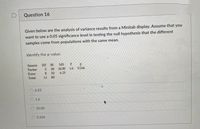
Transcribed Image Text:Question 16
Given below are the analysis of variance results from a Minitab display. Assume that you
want to use a 0.05 significance level in testing the null hypothesis that the different
samples come from populations with the same mean.
Identify the p-value.
Source
DF
SS
MS
Factor
30
10.00
1.6
0.264
Enor
50
6.25
Total
11 80
O 6.25
1.6
10.00
0.264
Expert Solution
This question has been solved!
Explore an expertly crafted, step-by-step solution for a thorough understanding of key concepts.
This is a popular solution
Trending nowThis is a popular solution!
Step by stepSolved in 2 steps with 1 images

Knowledge Booster
Learn more about
Need a deep-dive on the concept behind this application? Look no further. Learn more about this topic, statistics and related others by exploring similar questions and additional content below.Similar questions
- A company would like to know if efficiency can be improved through a training course for employees. A sample of employees is taken. The time taken for an employee to complete a task before training and after training is observed.arrow_forwardplease don't provide hand writtin solution....arrow_forwardA brokerage firm wants to conduct a study to see if there is a linear relationship between the size of an account and the number of trades conducted each year. What would be the most appropriate procedure to use to analyze data to answer this question? Only choose a test that handles multiple comparisons if such a test is needed. O ANOVA (Analysis of Variance) O Regression Test of Slope or Correlation O Test for a Difference of Proportions O Chi-square test of association O Test for a Difference of Meansarrow_forward
- An engineer designed a valve that will regulate water pressure on an automobile engine. The engineer designed the valve such that it would produce a mean pressure of 5.5 pounds/square inch. It is believed that the valve performs above the specifications. The valve was tested on 24 engines and the mean pressure was 5.7 pounds/square inch with a variance of 0.49. A level of significance of 0.01 will be used. Assume the population distribution is approximately normal. Make the decision to reject or fail to reject the null hypothesis.arrow_forwardWhich of the following factors have each of the advantages listed when using analysis of variance? Multiple answers can be chosen. 1. Makes ANOVA more robust to departures from the assumption of normality. 2. Makes ANOVA more robust to departures from the assumption of equal variance. 3. Increases the power of the test. Options: Large sample size. Balanced design.arrow_forwardGiven below are the analysis of variance results from a Minitab display. Assume that you want to use a 0.05 significance level in testing the null hypothesis that the different samples come from populations with the same mean. Identify the value of the test statistic. Source DF MS F Factor 3 13.500 4.500 5.17 0.011 Error 16 13.925 0.870 Total 19 27.425 Seleccione una: O A. 5.17 О В. 0.011 O C. 4.500 O D. 13.500arrow_forward
- please assist I am lostarrow_forwarddescribe the difference between a one-sample t-test, a two-sample (independent-samples) t-test, a repeated measures (related-samples) t-test, and the analysis of variance (ANOVA).arrow_forwardA researcher wants to measure average cardiovascular health of university students and compare those scores to the average scores in the general population. Assuming that population variance is known, what statistical test is most appropriate for this study? independent-samples t-test single-sample t-test z-test for sample mean related-samples t-testarrow_forward
arrow_back_ios
arrow_forward_ios
Recommended textbooks for you
 MATLAB: An Introduction with ApplicationsStatisticsISBN:9781119256830Author:Amos GilatPublisher:John Wiley & Sons Inc
 Probability and Statistics for Engineering and th...StatisticsISBN:9781305251809Author:Jay L. DevorePublisher:Cengage Learning
 Statistics for The Behavioral Sciences (MindTap C...StatisticsISBN:9781305504912Author:Frederick J Gravetter, Larry B. WallnauPublisher:Cengage Learning
 Elementary Statistics: Picturing the World (7th E...StatisticsISBN:9780134683416Author:Ron Larson, Betsy FarberPublisher:PEARSON
 The Basic Practice of StatisticsStatisticsISBN:9781319042578Author:David S. Moore, William I. Notz, Michael A. FlignerPublisher:W. H. Freeman
 Introduction to the Practice of StatisticsStatisticsISBN:9781319013387Author:David S. Moore, George P. McCabe, Bruce A. CraigPublisher:W. H. Freeman

MATLAB: An Introduction with Applications
Statistics
ISBN:9781119256830
Author:Amos Gilat
Publisher:John Wiley & Sons Inc

Probability and Statistics for Engineering and th...
Statistics
ISBN:9781305251809
Author:Jay L. Devore
Publisher:Cengage Learning

Statistics for The Behavioral Sciences (MindTap C...
Statistics
ISBN:9781305504912
Author:Frederick J Gravetter, Larry B. Wallnau
Publisher:Cengage Learning

Elementary Statistics: Picturing the World (7th E...
Statistics
ISBN:9780134683416
Author:Ron Larson, Betsy Farber
Publisher:PEARSON

The Basic Practice of Statistics
Statistics
ISBN:9781319042578
Author:David S. Moore, William I. Notz, Michael A. Fligner
Publisher:W. H. Freeman

Introduction to the Practice of Statistics
Statistics
ISBN:9781319013387
Author:David S. Moore, George P. McCabe, Bruce A. Craig
Publisher:W. H. Freeman