
MATLAB: An Introduction with Applications
6th Edition
ISBN: 9781119256830
Author: Amos Gilat
Publisher: John Wiley & Sons Inc
expand_more
expand_more
format_list_bulleted
Related questions
Question
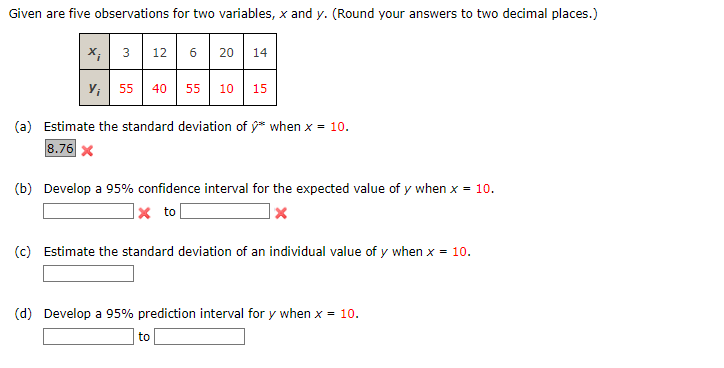

Transcribed Image Text:Given are five observations for two variables, x and y. (Round your answers to two decimal places.)
X, 3 12 6
Y; 55 40 55 10 15
150
20 14
(a) Estimate the standard deviation of * when x = 10.
8.76 X
(b) Develop a 95% confidence interval for the expected value of y when x = 10.
x to
X
(c) Estimate the standard deviation of an individual value of y when x = 10.
to
(d) Develop a 95% prediction interval for y when x = 10.
Expert Solution
This question has been solved!
Explore an expertly crafted, step-by-step solution for a thorough understanding of key concepts.

This is a popular solution
Step 1: Determine the given variables.
VIEW Step 2: Find the regression equation.
VIEW Step 3: Find the standard error of the estimate, sxx and predicted value of y when x = 10.
VIEW Step 4: Find the standard deviation of yhat* when x = 10.
VIEW Step 5: Find the confidence interval for expected value of y when x = 10.
VIEW Step 6: Find the standard deviation of an individual value of y when x = 10
VIEW Step 7: Find the predicion interval.
VIEW Solution
VIEW 
Trending nowThis is a popular solution!

Step by stepSolved in 8 steps with 23 images

Knowledge Booster

Similar questions
- How would u sovle thisarrow_forward1) Which is relatively better: a score of 88 on a Psychology test or a score of 45 on an Economics test? Scores on the Psychology test have a mean of 92 and a standard deviation of 10. Scores on the Economics test have a mean of 57 and a standard deviation of 5. Use measures of relative position to answer this exercise (Z-score).arrow_forward(1 point) A random sample of 70 observations produced a mean of a 39.5 from a population with a normal distribution and a standard deviation o = 2.14. (a) Find a 95% confidence interval for u (b) Find a 99% confidence interval for (c) Find a 90% confidence interval forarrow_forward
- A Scenario: Jimmy store sells large tins of Tom Tucker Coffee. The deli uses a periodic review system. Inventory is checked every 10 days which more orders are needed for tins. Order lead time is 3 days. Average demand is 7 tins, so average demand during the reorder period and order lead time (13) is 91 tins. Standard deviation of demand during the same 13 day period is 17 tins.1. Calculate the restocking level ( Assume the desired level is 90%)2. Suppose standard deviation of demand during the 13-day period drops to 4 tins. What happened to restocking level? Explain why?3. Draw a saw-tooth diagram. Beginning inventory level is equal to restocking level and the demand rate is a constant 7 tins per day. What is the safety stock level? What is the average inventory level?arrow_forwardi was wondering if i could get help with questions a and barrow_forwardThe mean exam score for 44. male high school students are 19.9 and the population standard deviation is 5.2. The mean exam score for 55female high school students is 19.4 and the population standard deviation is 4.9. At α=0.01, can you reject the claim that male and female high school students have equal exam scores? Complete parts (a) through (e). (a) Identify the claim and state H0 and Ha. What is the claim? A. Male high school students have lower exam scores than female students. B. Male and female high school students have different exam scores. C. Male and female high school students have equal exam scores. D. Male high school students have greater exam scores than female students. What are H0 and Ha? Find the critical value(s) and identify the rejection region(s). The critical value(s) is/are Find the standardized test statistic z for μ1−μ2.arrow_forward
- A standardized test is given to a sixth-grade class. Historically the mean score has been 151 with a standard deviation of 21. The superintendent believes that the standard deviation of performance may have recently decreased. She randomly sampled 23 students and found a mean of 161 with a standard deviation of 18.2898. Is there evidence that the standard deviation has decreased at the α=0.05 level? Step 1 of 5 : State of the hypotheses in terms of the standard deviation. Round the standard deviation to four decimal places when necessary Step 2 of 5 : Determine the critical value(s) of the test statistic. If the test is two-tailed, separate the values with a comma. Round your answer to three decimal places. Step 3 of 5 : Determine the value of the test statistic. Round your answer to three decimal places. Step 4 of 5 : Make the decision. Step 5 of 5 : What is the conclusion?arrow_forward(1 point) A random sample of 110 observations produced a mean of x = 34.7 from a population with a normal distribution and a standard deviation o = 4.39. (a) Find a 99% confidence interval for u (b) Find a 95% confidence interval for (c) Find a 90% confidence interval for uarrow_forwardThe expectation of X, which is also known as the mean or average, is E(X) = 7 and the Variance of X is var(X) =4. Using the equation Y = 11X + 81. What are the expected value E(Y), variance VAR(Y), and standard deviation SD(Y) of this expression.arrow_forward
arrow_back_ios
arrow_forward_ios
Recommended textbooks for you
- MATLAB: An Introduction with ApplicationsStatisticsISBN:9781119256830Author:Amos GilatPublisher:John Wiley & Sons Inc
 Probability and Statistics for Engineering and th...StatisticsISBN:9781305251809Author:Jay L. DevorePublisher:Cengage Learning
 Statistics for The Behavioral Sciences (MindTap C...StatisticsISBN:9781305504912Author:Frederick J Gravetter, Larry B. WallnauPublisher:Cengage Learning
  Elementary Statistics: Picturing the World (7th E...StatisticsISBN:9780134683416Author:Ron Larson, Betsy FarberPublisher:PEARSON
 The Basic Practice of StatisticsStatisticsISBN:9781319042578Author:David S. Moore, William I. Notz, Michael A. FlignerPublisher:W. H. Freeman
 Introduction to the Practice of StatisticsStatisticsISBN:9781319013387Author:David S. Moore, George P. McCabe, Bruce A. CraigPublisher:W. H. Freeman
MATLAB: An Introduction with Applications
Statistics
ISBN:9781119256830
Author:Amos Gilat
Publisher:John Wiley & Sons Inc
Probability and Statistics for Engineering and th...
Statistics
ISBN:9781305251809
Author:Jay L. Devore
Publisher:Cengage Learning
Statistics for The Behavioral Sciences (MindTap C...
Statistics
ISBN:9781305504912
Author:Frederick J Gravetter, Larry B. Wallnau
Publisher:Cengage Learning
Elementary Statistics: Picturing the World (7th E...
Statistics
ISBN:9780134683416
Author:Ron Larson, Betsy Farber
Publisher:PEARSON
The Basic Practice of Statistics
Statistics
ISBN:9781319042578
Author:David S. Moore, William I. Notz, Michael A. Fligner
Publisher:W. H. Freeman
Introduction to the Practice of Statistics
Statistics
ISBN:9781319013387
Author:David S. Moore, George P. McCabe, Bruce A. Craig
Publisher:W. H. Freeman