
MATLAB: An Introduction with Applications
6th Edition
ISBN: 9781119256830
Author: Amos Gilat
Publisher: John Wiley & Sons Inc
expand_more
expand_more
format_list_bulleted
Related questions
Question
Statistic question. Please help.
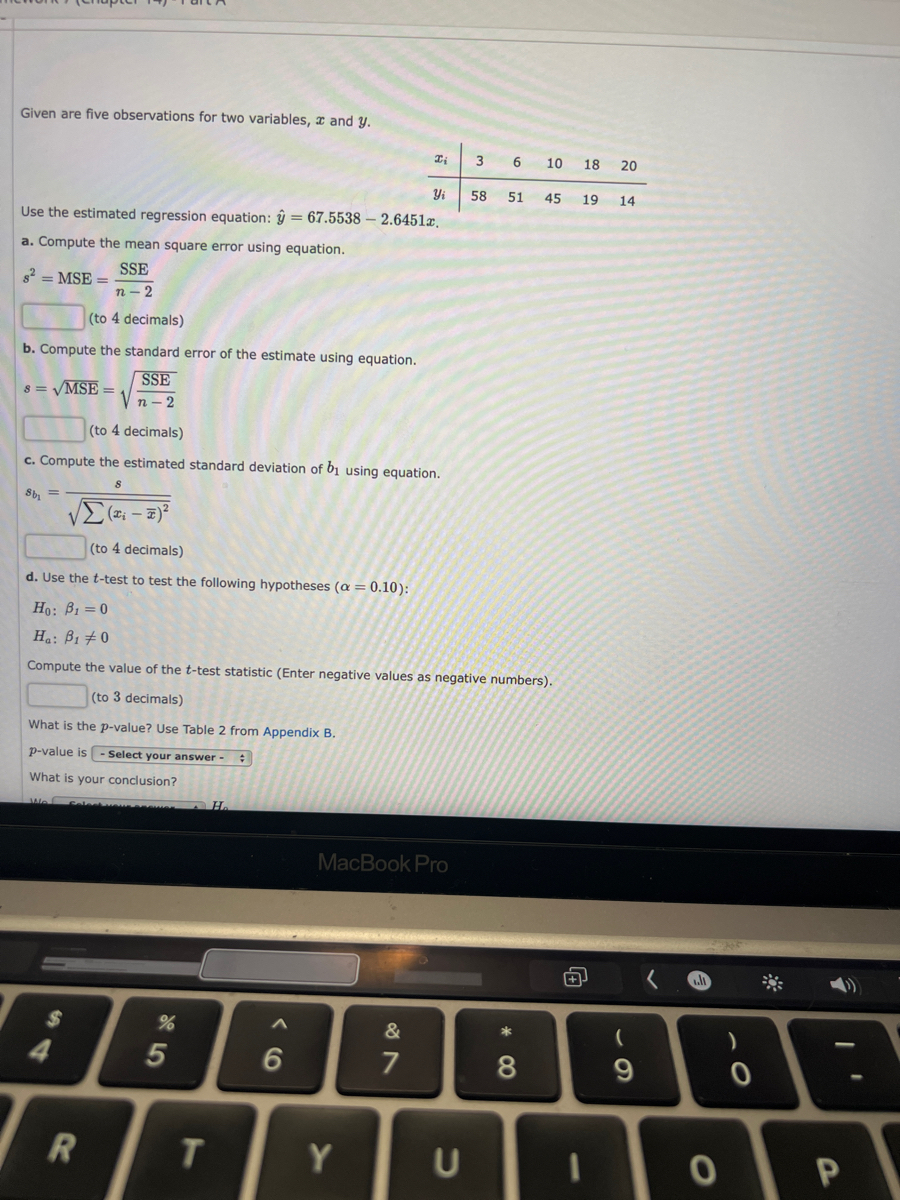

Transcribed Image Text:Given are five observations for two variables, and y.
(to 4 decimals)
b. Compute the standard error of the estimate using equation.
8 = √MSE =
SSE
Vn-2
Use the estimated regression equation: = 67.5538 -2.64512.
a. Compute the mean square error using equation.
s² = MSE=
SSE
n-2
(to 4 decimals)
c. Compute the estimated standard deviation of b₁ using equation.
8b₁ =
What is the p-value? Use Table 2 from Appendix B.
p-value is - Select your answer - #
What is your conclusion?
$
R
%
5
T
Ii
6
Yi
Σ(x₁ - x)²
(to 4 decimals)
d. Use the t-test to test the following hypotheses (α = 0.10):
Ho: B1=0
Ha: B10
Compute the value of the t-test statistic (Enter negative values as negative numbers).
(to 3 decimals)
Y
MacBook Pro
&
7
3
U
58
6
51
*
10
8
18 20
45 19 14
(
9
0
0
7
I'
P
![Ho: B1=0
Ha: 810
Compute the value of the t-test statistic (Enter negative values as negative numbers).
(to 3 decimals)
What is the p-value? Use Table 2 from Appendix B.
p-value is - Select your answer - :
What is your conclusion?
We-Select your answer - Ho.
e. Use the F-test to test the hypotheses in part (d) at a 0.10 level of significance.
Complete the F table below using Excel. Calculate the Sum of Squares (to 1 decimal), the Mean Squares (to 1 decimal), and the F ratio (to 2 decimals) and the
p-value (to 4 decimals).
Source
of Variation
Regression
Error
Total
O Icon Key
What is your conclusion, based on this F test?
We-Select your answer - Ho.
$
4
]:
7
R
Degrees
of Freedom
F
V
%
5
Sum of
Squares
T
6
B
Mean
Square
MacBook Pro
Y
H
&
7
N
F
U
* 00
8
J
p-value
t
1
M
(
9
K
A
O
V
)
O
Save
L
Question 4 of 4
Submit Assignment for Grading
P
V
:
24
+ 11
{
[
11
~-
?](https://content.bartleby.com/qna-images/question/95b27bbf-a33e-4d69-938a-12d649d4f4fe/32a442cd-524a-4f0d-8a82-999c687d65de/rai14hj_processed.jpeg)
Transcribed Image Text:Ho: B1=0
Ha: 810
Compute the value of the t-test statistic (Enter negative values as negative numbers).
(to 3 decimals)
What is the p-value? Use Table 2 from Appendix B.
p-value is - Select your answer - :
What is your conclusion?
We-Select your answer - Ho.
e. Use the F-test to test the hypotheses in part (d) at a 0.10 level of significance.
Complete the F table below using Excel. Calculate the Sum of Squares (to 1 decimal), the Mean Squares (to 1 decimal), and the F ratio (to 2 decimals) and the
p-value (to 4 decimals).
Source
of Variation
Regression
Error
Total
O Icon Key
What is your conclusion, based on this F test?
We-Select your answer - Ho.
$
4
]:
7
R
Degrees
of Freedom
F
V
%
5
Sum of
Squares
T
6
B
Mean
Square
MacBook Pro
Y
H
&
7
N
F
U
* 00
8
J
p-value
t
1
M
(
9
K
A
O
V
)
O
Save
L
Question 4 of 4
Submit Assignment for Grading
P
V
:
24
+ 11
{
[
11
~-
?
Expert Solution
This question has been solved!
Explore an expertly crafted, step-by-step solution for a thorough understanding of key concepts.

This is a popular solution

Trending nowThis is a popular solution!

Step by stepSolved in 2 steps

Knowledge Booster

Similar questions
- Correlation does not imply causation. What does this mean? Find an example in the media that needs to understand this concept and explain it to your peers. Be sure to include the link to the example you are using.arrow_forwardLetter (d) Would i be wrong if i said yes the data set consisting of the annual salary for each employee at the MNM company is a population since no employee salary is excluded from the dataarrow_forwardYou developed a way to measure anger people. Test the claim that the mean score of anger for younger people is equal to the mean score for older people. Use a significance level of .06. The scores are listed below. Scores for younger people: 25, 33, 19, 8, 39, 29, 28, 18, 41, 3, 27, 35, 14, 25, 36, 4, 11 Scores for older people: 38, 35, 21, 5, 19, 22, 35, 33, 54, 3, 55, 9, 15, 22, 47, 4, 21arrow_forward
- The response rate of a survey is the proportion of all people who were selected but did not complete the survey. True Falsearrow_forwardUsing bike weight to predict bike price what would be the response variable here?arrow_forwardHW10Q8 PLEASE FIND AND LABEL TEST STAT, P VALUE, AS WELL THANK YOU!arrow_forward
arrow_back_ios
arrow_forward_ios
Recommended textbooks for you
- MATLAB: An Introduction with ApplicationsStatisticsISBN:9781119256830Author:Amos GilatPublisher:John Wiley & Sons Inc
 Probability and Statistics for Engineering and th...StatisticsISBN:9781305251809Author:Jay L. DevorePublisher:Cengage Learning
 Statistics for The Behavioral Sciences (MindTap C...StatisticsISBN:9781305504912Author:Frederick J Gravetter, Larry B. WallnauPublisher:Cengage Learning
  Elementary Statistics: Picturing the World (7th E...StatisticsISBN:9780134683416Author:Ron Larson, Betsy FarberPublisher:PEARSON
 The Basic Practice of StatisticsStatisticsISBN:9781319042578Author:David S. Moore, William I. Notz, Michael A. FlignerPublisher:W. H. Freeman
 Introduction to the Practice of StatisticsStatisticsISBN:9781319013387Author:David S. Moore, George P. McCabe, Bruce A. CraigPublisher:W. H. Freeman
MATLAB: An Introduction with Applications
Statistics
ISBN:9781119256830
Author:Amos Gilat
Publisher:John Wiley & Sons Inc
Probability and Statistics for Engineering and th...
Statistics
ISBN:9781305251809
Author:Jay L. Devore
Publisher:Cengage Learning
Statistics for The Behavioral Sciences (MindTap C...
Statistics
ISBN:9781305504912
Author:Frederick J Gravetter, Larry B. Wallnau
Publisher:Cengage Learning
Elementary Statistics: Picturing the World (7th E...
Statistics
ISBN:9780134683416
Author:Ron Larson, Betsy Farber
Publisher:PEARSON
The Basic Practice of Statistics
Statistics
ISBN:9781319042578
Author:David S. Moore, William I. Notz, Michael A. Fligner
Publisher:W. H. Freeman
Introduction to the Practice of Statistics
Statistics
ISBN:9781319013387
Author:David S. Moore, George P. McCabe, Bruce A. Craig
Publisher:W. H. Freeman