MATLAB: An Introduction with Applications
6th Edition
ISBN: 9781119256830
Author: Amos Gilat
Publisher: John Wiley & Sons Inc
expand_more
expand_more
format_list_bulleted
Question

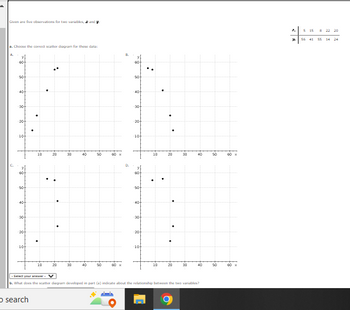
Transcribed Image Text:Given are five observations for two variables, and y.
a. Choose the correct scatter diagram for these data:
10-
-40
10+
10
O search
10
20
20
30
3⁰0
40
40
50
-50
-40-
-90
-20
-10-
50
-40-
-90-
-20
10-
10
10
20
20
30
30
to
40
-Select your answer.
b. What does the scatter diagram developed in part (a) indicate about the relationship between the two variables?
50
2,
M
5 15
56 41
8 22 20
55 14

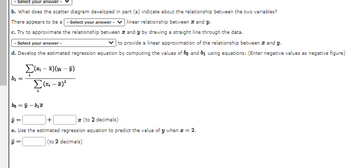
Transcribed Image Text:- Select your answer -
b. What does the scatter diagram developed
There appears to be a - Select your answer -
c. Try to approximate the relationship between
and y by drawing a straight line through the data.
Select your answer -
✓to provide a linear approximation of the relationship between and y.
d. Develop the estimated regression equation by computing the values of bo and by using equations: (Enter negative values as negative figure)
b₁ =
Σ(x; - E)(m - v)
(-²
part (a) indicate about the relationship between the two variables?
linear relationship between and y.
boÿ-b₂
+
(to 2 decimals)
e. Use the estimated regression equation to predict the value of y when * = 2.
y =
(to 2 decimals)
Expert Solution
This question has been solved!
Explore an expertly crafted, step-by-step solution for a thorough understanding of key concepts.
Step by stepSolved in 3 steps with 4 images

Knowledge Booster
Similar questions
- Given the data set : 7,19,8,1,30,43,14,6,40 Identify the flowing values that would be used when creating the box plot Highest: Upper quartile: Median : Lower quartile: Lowestarrow_forwardIn a scatter diagram of the data of 50 participants, how many points are plotted? A. 5 B. 25 C. 50 D. 100arrow_forwardFind the skew of this data set: 2,2,3,4,5,6 (Answer : 3 decimal place)arrow_forward
- Twenty-five randomly selected students were asked the number of movies they watched the previous week. The results are as follows. # of movies Frequency Relative Frequency Cumulative Relative Frequency 0 5 1 9 2 6 3 4 4 1 Table 2.67 Construct a histogram of the data. Complete the columns of the chart.arrow_forwardFor each vignette, choose the type of research that is being conducted. There is only one correct answer for each vignette. Here are your answer choices for questions 1-18 Case Study Naturalistic Observation Laboratory Observation Survey Correlation Test Experiment Longitudinal Design Cross Section Cross Sequential Design Maria wants to understand the political demographics in her community, so she creates a questionnaire asking people to identify their age, gender, political affiliation, religion and marital status. After Maria collects the abovementioned data (in question #12), she then identifies the relationships between religion and political affiliation. Kathi…arrow_forwardMake a Box plot for each data interpreter answer. A. Data b: 33,22,23,29,40,43,47,49arrow_forward
arrow_back_ios
arrow_forward_ios
Recommended textbooks for you
 MATLAB: An Introduction with ApplicationsStatisticsISBN:9781119256830Author:Amos GilatPublisher:John Wiley & Sons Inc
 Probability and Statistics for Engineering and th...StatisticsISBN:9781305251809Author:Jay L. DevorePublisher:Cengage Learning
 Statistics for The Behavioral Sciences (MindTap C...StatisticsISBN:9781305504912Author:Frederick J Gravetter, Larry B. WallnauPublisher:Cengage Learning
 Elementary Statistics: Picturing the World (7th E...StatisticsISBN:9780134683416Author:Ron Larson, Betsy FarberPublisher:PEARSON
 The Basic Practice of StatisticsStatisticsISBN:9781319042578Author:David S. Moore, William I. Notz, Michael A. FlignerPublisher:W. H. Freeman
 Introduction to the Practice of StatisticsStatisticsISBN:9781319013387Author:David S. Moore, George P. McCabe, Bruce A. CraigPublisher:W. H. Freeman

MATLAB: An Introduction with Applications
Statistics
ISBN:9781119256830
Author:Amos Gilat
Publisher:John Wiley & Sons Inc

Probability and Statistics for Engineering and th...
Statistics
ISBN:9781305251809
Author:Jay L. Devore
Publisher:Cengage Learning

Statistics for The Behavioral Sciences (MindTap C...
Statistics
ISBN:9781305504912
Author:Frederick J Gravetter, Larry B. Wallnau
Publisher:Cengage Learning

Elementary Statistics: Picturing the World (7th E...
Statistics
ISBN:9780134683416
Author:Ron Larson, Betsy Farber
Publisher:PEARSON

The Basic Practice of Statistics
Statistics
ISBN:9781319042578
Author:David S. Moore, William I. Notz, Michael A. Fligner
Publisher:W. H. Freeman

Introduction to the Practice of Statistics
Statistics
ISBN:9781319013387
Author:David S. Moore, George P. McCabe, Bruce A. Craig
Publisher:W. H. Freeman