
MATLAB: An Introduction with Applications
6th Edition
ISBN: 9781119256830
Author: Amos Gilat
Publisher: John Wiley & Sons Inc
expand_more
expand_more
format_list_bulleted
Related questions
Question
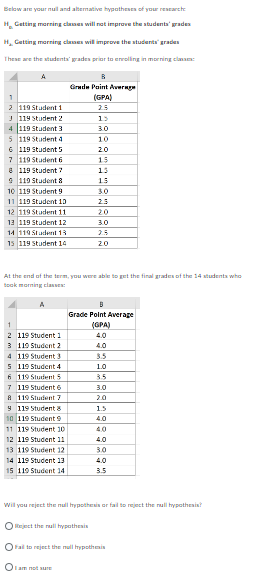

Transcribed Image Text:Below are your null and alternative hypotheses of your researche
H Getting morning classes will not improve the students' grades
H, Getting morning classes will improve the students' grades
These are the students' grades prior to enrolling in morning classm
A
2 119 Student 1
3 119 Student 2
4
119 Student 3
5
6
119 Student 4
119 Student 5
119 Student 6
7
8 119 Student?
9 119 Student 8
10 119 Student 9
11 119 Student 10
12 119 Student 11
13 119 Student 12
14 119 Student 13
15 119 Student 14
A
1
2 119 Student 1
3 119 Student 2
4 119 Student 3
5 119 Student 4
6
119 Student 5
7 119 Student 6
8
119 Student 7
9
119 Student &
10 119 Student 9
11 119 Student 10
12 119 Student 11
13 119 Student 12
14 119 Student 13
15 110 Student 14
B
Grade Paint Average
(GPA)
2.5
At the end of the term, you were able to get the final grades of the 14 students who
took morning classes:
13
3.0
10
20
1.5
13
15
2.5
20
3.0
2.5
20
I am not sure
B
Grade Point Average
(GPA)
4.0
3.5
1.0
3.5
3.0
2.0
1.5
4.0
3.0
4.0
3.5
Will you reject the null hypothesis or fail to reject the null hypothesis?
Reject the mall hypothesis
Fail to reject the null hypothesis
Expert Solution
This question has been solved!
Explore an expertly crafted, step-by-step solution for a thorough understanding of key concepts.

Step by stepSolved in 2 steps with 2 images

Knowledge Booster

Similar questions
- File Home Insert Share Page Layout D✓ 0 H17 ▲ 1 2 3 4 5 6 7 8 9 10 11 12 13 14 15 16 17 18 19 20 21 22 23 24 25 26 27 4 < $ * * * * * * * * * * * * * * * * Y 3 Arial x ✓ fx B College High School 564 576 564 588 576 492 516 420 408 432 420 444 Data + C ✓ 10 ✓ Part b Mean Formulas Data Review View Help BIF A Mean Variance Difference Between the Means D Observations Hypothesized Mean Difference df t Stat P(T<=t) one-tail t Critical one-tail P(T<=t) two-tail t Critical two-tail Part c T Test: Two-Sample Assuming Unequal Variances Part d Significance Level (Alpha) Can we reject the null hypothesis? (Enter "Can" or "Cannot") E College 563 63 Can 432 15 0 22 2.62234862 0.007777448 1.717144335 0.015554897 2.073873058 Ev 571.7333333 494.1818182 5978.209524 5236.363636 0.05 F High School Draw 500 564 11 G General Formula H |=AVERAGE(A:A) =E3-F3 $ =IF(E17arrow_forward1 of 10 The temperature on Monday in Minot, North Dakota was 3°F. On Tuesday, the temperature was -2°F. How did the temperature change from Monday to Tuesday? • The temperature decreased 1 degree. O The temperature decreased 5 degrees. O The temperature increased 1 degree. O The temperature increased 5 degrees. NC DELL #3 & 2 W くO 5arrow_forward#22 please use table for this question. Please type explanation since hand writing is harder to read with steps and clear explanation.arrow_forwardof the votes. How many votes did Nominee A In a poll, 327 students voted. Nominee A received receive? |votes (Type a whole number.) Enter your answer in the answer box and then click Check Answer. All parts showing Clear All Check Answer Review progress Question 8 of 9 + Back Next Eype here to search 40 4. S441 20 insert %23 & 4 6. 80 W D K V. MI pause alt ctri #: G)arrow_forwardTime Left:0:52:00 Dwayne Cordes: Attempt 1 17. The exam scores (out of 100 points) for all students taking an introductory Statistics course are used to construct the following boxplot. 20 00L 08 09 Exam Scorearrow_forwardHelparrow_forwardO A bike trail 13 miles long connects a coffee shop to a bike shop. There is a water fountain 5 miles from the coffee shop and 12 miles from the bike shop. Which of the following diagrams represents the relationship between the coffee shop, C, the bike shop, B, and the water fountain, W? O Submit Answer 14 W B W C O 44 DELL Oll ✓ INTLarrow_forwardP A ud nes 0 OW A 121. Le X E ← → C M Gmail N LaFamilia ATI Spectrum WiFi Rout... - Save & Exit Certify Lesson: 6.2 Perimeter Question 10 of 10, Step 1 of 1 learn.hawkeslearning.com/Portal/Lesson/l... ㅏ 7/10 Correct Answer How to enter your answer (opens in new window) + 6 yd Q☆ YouTube Mail-Camille Y Per... A regular heptagon is a seven-sided figure with all sides equal and all seven angles equal. Find the perimeter of a regular heptagon with one side measuring 6 yd. CAMILLE PEREZ Darrow_forwardD YouTube A Exit Tickets-8.4 Lesson 10 (8,E x Tutor cutor.assistments.org/TutorClient/student/index.html?assignmentRef=75e85b43-7221-43f3-b460-8074aaffa61e&pr=TNG&ut=6e0e517a-5d55-4028-8a O O Uh oh! L Untitled document https://clever.com/ McDonald's Career. 6 YouthWorks > Watch Anime Onlin. TextNow ed: 0 Assignment: Exit Tickets---8.4 Lesson 10 (8.EE.B.5) "3 Problem ID: PRA3H2R Alex skateboards at a constant speed from his house to school 3.8 miles away. It takes him 18 minutes. What fraction represents his constant speed, C? engage Modified from E Type your answer betow mathemetical expression 3.8 Sorry, try again: "3.8" is not correct Submit Answerarrow_forwardS CC MATH 8B: TERM AS- PER S This is a locked assignment.8 X K MARIA AGUILAR MARTINEZ O (517) Math 8 3 7 Homework x b My Tutoring | bartleby A web.kamihq.com/web/viewer.html?state=%7B"ids"%3A%5B"1JpKLIligEBEvxpHdaV6_TBp174Qk7Ufej"%5D%2C"action"%3A"open"%2C"u. G O mymail.lausd.net bookmarks 9 cffywehg image a51aa1f75d. 9 Grades | Schoology O Play MAR P.5 Class. MARIA AGUILAR M. Kami Student Edu P A Kami Schoolo. ► MARIA AGUILAR MARTINEZ - 8.3.3_Four Representations.pdf + 100% A Turn In * e = MA Select Dictionary Graph: Equation Label each axis! Text to Speech Let x represent the number of steps Jada takes and let y represent the number of steps Noah takes A Markup Comment y = x Т Tеxt Box Screenshot• now a ÷ Equation Screenshot taken What is the constant of proportionality? Wh Show in folder does it mean? Drawing .... DA E U For Regresentations a en Shapes Jadand Noah couted heumber of epe hey lance Towah the same otance Jada o stepa whe Noh to 1p then hey und hathen No took 5 de t12 e…arrow_forwardWheat Acreage in Selected States The pictograph to the right shows the number of acres devoted to wheat production in selected states in a given year. Which state(s) plant less than 9,000,000 acres of wheat? State A 41 State B 11* State C 11A State D 44 State E 11 State F 44114 State G 4 State H -2 million acres Select all that apply. A. state A B. state B C. state C D. state D E. state E F. state F G. state G H. state Harrow_forwardarrow_back_iosarrow_forward_ios
Recommended textbooks for you
- MATLAB: An Introduction with ApplicationsStatisticsISBN:9781119256830Author:Amos GilatPublisher:John Wiley & Sons Inc
 Probability and Statistics for Engineering and th...StatisticsISBN:9781305251809Author:Jay L. DevorePublisher:Cengage Learning
 Statistics for The Behavioral Sciences (MindTap C...StatisticsISBN:9781305504912Author:Frederick J Gravetter, Larry B. WallnauPublisher:Cengage Learning
  Elementary Statistics: Picturing the World (7th E...StatisticsISBN:9780134683416Author:Ron Larson, Betsy FarberPublisher:PEARSON
 The Basic Practice of StatisticsStatisticsISBN:9781319042578Author:David S. Moore, William I. Notz, Michael A. FlignerPublisher:W. H. Freeman
 Introduction to the Practice of StatisticsStatisticsISBN:9781319013387Author:David S. Moore, George P. McCabe, Bruce A. CraigPublisher:W. H. Freeman
MATLAB: An Introduction with Applications
Statistics
ISBN:9781119256830
Author:Amos Gilat
Publisher:John Wiley & Sons Inc
Probability and Statistics for Engineering and th...
Statistics
ISBN:9781305251809
Author:Jay L. Devore
Publisher:Cengage Learning
Statistics for The Behavioral Sciences (MindTap C...
Statistics
ISBN:9781305504912
Author:Frederick J Gravetter, Larry B. Wallnau
Publisher:Cengage Learning
Elementary Statistics: Picturing the World (7th E...
Statistics
ISBN:9780134683416
Author:Ron Larson, Betsy Farber
Publisher:PEARSON
The Basic Practice of Statistics
Statistics
ISBN:9781319042578
Author:David S. Moore, William I. Notz, Michael A. Fligner
Publisher:W. H. Freeman
Introduction to the Practice of Statistics
Statistics
ISBN:9781319013387
Author:David S. Moore, George P. McCabe, Bruce A. Craig
Publisher:W. H. Freeman