
Algebra & Trigonometry with Analytic Geometry
13th Edition
ISBN: 9781133382119
Author: Swokowski
Publisher: Cengage
expand_more
expand_more
format_list_bulleted
Related questions
Question
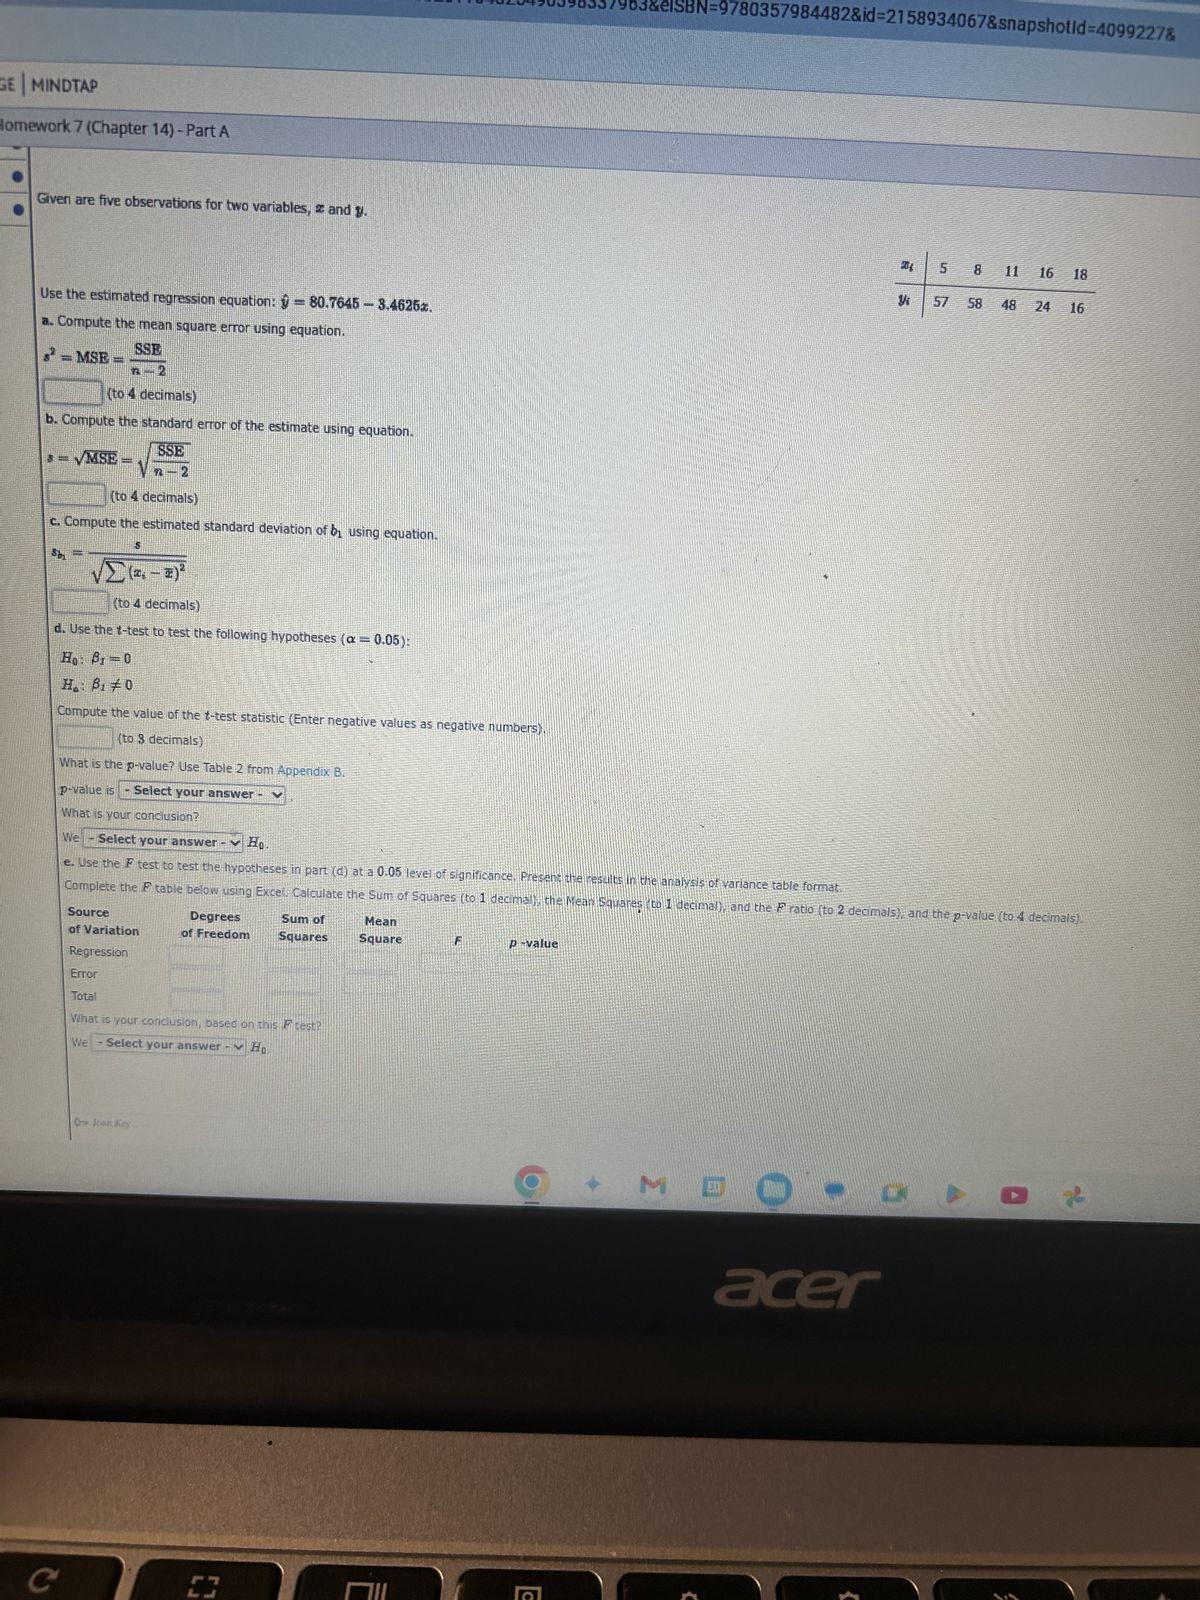

Transcribed Image Text:GE | MINDTAP
Homework 7 (Chapter 14) - Part A
C
Given are five observations for two variables, and y.
Use the estimated regression equation:= 80.7645 - 3.4625x.
a. Compute the mean square error using equation.
SSE
=MSE=
८-५
(to 4 decimals)
b. Compute the standard error of the estimate using equation.
=VMSE
SSE
(to 4 decimals)
c. Compute the estimated standard deviation of by using equation.
SH
5
40398537963&elSBN 9780357984482&id=2158934067&snapshotid=4099227&
5
8 11
16
18
Y
57
58
48
24
16
(to 4 decimals)
d. Use the t-test to test the following hypotheses (a = 0.05):
Ho: 8=0
H 8.0
Compute the value of the t-test statistic (Enter negative values as negative numbers).
(to 3 decimals)
What is the p-value? Use Table 2 from Appendix B.
p-value is Select your answer -
What is your conclusion?
We
Select your answer - Ho.
e. Use the F test to test the hypotheses in part (d) at a 0.05 level of significance. Present the results in the analysis of variance table format.
Source
Complete the table below using Excel. Calculate the Sum of Squares (to 1 decimal), the Mean Squares (to 1 decimal), and the F ratio (to 2 decimals), and the p-value (to 4 decimals).
Degrees
Sum of
of Variation
of Freedom
Squares
Regression
Error
Total
Mean
Square
P-value
What is your conclusion, based on this P test?
We
Select your answer - Ho
Icon Key
LJ
G
acer
>
Expert Solution
This question has been solved!
Explore an expertly crafted, step-by-step solution for a thorough understanding of key concepts.

Step by stepSolved in 2 steps with 2 images

Knowledge Booster

Similar questions
- Find the mean hourly cost when the cell phone described above is used for 240 minutes.arrow_forwardWhat does the y -intercept on the graph of a logistic equation correspond to for a population modeled by that equation?arrow_forwardDoes Table 1 represent a linear function? If so, finda linear equation that models the data.arrow_forward
- Can the average rate of change of a function be constant?arrow_forwardOlympic Pole Vault The graph in Figure 7 indicates that in recent years the winning Olympic men’s pole vault height has fallen below the value predicted by the regression line in Example 2. This might have occurred because when the pole vault was a new event there was much room for improvement in vaulters’ performances, whereas now even the best training can produce only incremental advances. Let’s see whether concentrating on more recent results gives a better predictor of future records. (a) Use the data in Table 2 (page 176) to complete the table of winning pole vault heights shown in the margin. (Note that we are using x=0 to correspond to the year 1972, where this restricted data set begins.) (b) Find the regression line for the data in part ‚(a). (c) Plot the data and the regression line on the same axes. Does the regression line seem to provide a good model for the data? (d) What does the regression line predict as the winning pole vault height for the 2012 Olympics? Compare this predicted value to the actual 2012 winning height of 5.97 m, as described on page 177. Has this new regression line provided a better prediction than the line in Example 2?arrow_forwardFind the equation of the regression line for the following data set. x 1 2 3 y 0 3 4arrow_forward
- Suppose that for a typical FedEx package delivery, the cost of the shipment is a function of the weight of the package measured in ounces. You want to try to predict the cost of a typical shipment given package dimensions. If 10 packages in a city are sampled and the regression output is given below, report the regression equation. 1) (cost of delivery) = 1.468*(weight) - 23.015 2) (weight) = -23.015*(cost of delivery) + 1.468 3) (cost of delivery) = -23.015*(weight) + 1.468 4) (cost of delivery) = 1.468*(weight) 5) (weight) = 1.468*(cost of delivery) - 23.015arrow_forwardThe money raised and spent (both in millions of dollars) by all congressional campaigns for 8 recent 2-year periods are shown in the table. The equation of A the regression line is y = 0.952x+20.570. Find the standard error of estimates, and interpret the result. Money ralsed, x Money spent, y 460.5 434.1 651.5 689.3 Find the standard error of estimate s and interpret the result. (Round to three decimal places as needed.) 738.8 735.3 780.3 755.8 781.2 732.5 1025.3 1011.3 950.6 929.9 1205.2 11554arrow_forwardThe following table gives the data for the grades on the midterm exam and the grades on the final exam. Determine the equation of the regression line, yˆ=b0+b1x�^=�0+�1�. Round the slope and y-intercept to the nearest thousandth. Grades on Midterm and Final Exams Grades on Midterm 7171 6262 7878 9494 8383 8181 8080 9494 8585 6262 Grades on Final 8888 7979 8888 9191 8080 7070 7171 9393 6565 7777arrow_forward
- please only answer the last part "Suppose that real income per capita in New Jersey increases by 1% in the next year. Use the results in column (4) to predict the change in the number of traffic fatalities in the next year. "arrow_forwardUsing the data below, determine the value of the slope B, in the linear regression line ŷ = B, + B1x. Give your answer to three decimal places. 2Ti = 1079, 4 = 1100, } = 67070 u? = 74908, C;Yi = 67546, n = 20arrow_forwardThe slope of a regression line tells you how much or little a change in your dependent variable impacts your independent variable. O TrueO Falsearrow_forward
arrow_back_ios
SEE MORE QUESTIONS
arrow_forward_ios
Recommended textbooks for you
- Algebra & Trigonometry with Analytic GeometryAlgebraISBN:9781133382119Author:SwokowskiPublisher:Cengage
 Glencoe Algebra 1, Student Edition, 9780079039897...AlgebraISBN:9780079039897Author:CarterPublisher:McGraw Hill
 College Algebra (MindTap Course List)AlgebraISBN:9781305652231Author:R. David Gustafson, Jeff HughesPublisher:Cengage Learning
 Big Ideas Math A Bridge To Success Algebra 1: Stu...AlgebraISBN:9781680331141Author:HOUGHTON MIFFLIN HARCOURTPublisher:Houghton Mifflin Harcourt
 Algebra and Trigonometry (MindTap Course List)AlgebraISBN:9781305071742Author:James Stewart, Lothar Redlin, Saleem WatsonPublisher:Cengage Learning
Algebra & Trigonometry with Analytic Geometry
Algebra
ISBN:9781133382119
Author:Swokowski
Publisher:Cengage
Glencoe Algebra 1, Student Edition, 9780079039897...
Algebra
ISBN:9780079039897
Author:Carter
Publisher:McGraw Hill
College Algebra (MindTap Course List)
Algebra
ISBN:9781305652231
Author:R. David Gustafson, Jeff Hughes
Publisher:Cengage Learning
Big Ideas Math A Bridge To Success Algebra 1: Stu...
Algebra
ISBN:9781680331141
Author:HOUGHTON MIFFLIN HARCOURT
Publisher:Houghton Mifflin Harcourt
Algebra and Trigonometry (MindTap Course List)
Algebra
ISBN:9781305071742
Author:James Stewart, Lothar Redlin, Saleem Watson
Publisher:Cengage Learning