
MATLAB: An Introduction with Applications
6th Edition
ISBN: 9781119256830
Author: Amos Gilat
Publisher: John Wiley & Sons Inc
expand_more
expand_more
format_list_bulleted
Related questions
Topic Video
Question
Identify Ho and Ha for a paired t-test to determine if there is a difference in the number of breeding horseshoe crabs from 2011 to 2012:
The mean difference between paired observations is zero.
The mean difference between paired observations is not zero.
Use the paired t-test
Report your answer to three decimal places.
Do you fail to reject or reject the null hypothesis?
Were the number of breeding horseshoe crabs the same or different between between the two years?
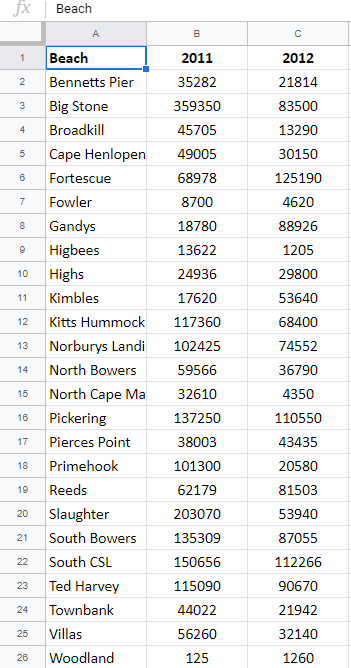

Transcribed Image Text:fx
Beach
в
Beach
2011
2012
Bennetts Pier
35282
21814
Big Stone
359350
83500
Broadkill
45705
13290
4
Cape Henlopen
49005
30150
Fortescue
68978
125190
Fowler
8700
4620
Gandys
18780
88926
Higbees
13622
1205
Highs
24936
29800
10
11
Kimbles
17620
53640
12
Kitts Hummock
117360
68400
Norburys Landi
102425
74552
13
14
North Bowers
59566
36790
North Cape Ma
32610
4350
15
Pickering
137250
110550
16
17
Pierces Point
38003
43435
18
Primehook
101300
20580
19
Reeds
62179
81503
Slaughter
203070
53940
20
South Bowers
135309
87055
22
South CSL
150656
112266
Ted Harvey
115090
90670
23
24
Townbank
44022
21942
25
Villas
56260
32140
26
Woodland
125
1260
21
Expert Solution
This question has been solved!
Explore an expertly crafted, step-by-step solution for a thorough understanding of key concepts.

This is a popular solution

Trending nowThis is a popular solution!

Step by stepSolved in 3 steps with 5 images

Knowledge Booster


Learn more about
Need a deep-dive on the concept behind this application? Look no further. Learn more about this topic, statistics and related others by exploring similar questions and additional content below.Similar questions
- Discribe the scores in a sample that has a standard deviation of zero.arrow_forwardExhibit 6-5The weight of items produced by a machine is normally distributed with a mean of 8 ounces and a standard deviation of 2 ounces. Refer to Exhibit 6-5. What percentage of items will weigh between 6.4 and 8.9 ounces?arrow_forwardQUESTION 3 What percent of scores are below an SAT score of 560?arrow_forward
- A successful basketball player has a height of 6 feet 11 inches, or 211 cm. Based on statistics from a data set, his height converts to the z score of 5.17. How many standard deviations is his height above the mean?arrow_forwardQUESTION 7 Given an x-mean3D3.4, SSx-97.3, y-mean33.9, SSy-45.2, Sxy-55.5, and a sample size of 45, calculate the following: X Sample Standard Deviation and Y Sample Standard Deviation X Population Standard Deviation and Y Population Standard Deviation Sample Covariance and Population Covariance Sample Correlation and Population Correlationarrow_forwardThe weight loss for the first six months of a diet program is normally distributed with an average 40 pounds and a standard deviation of 20 pounds. How much weight would a participant have to loss to be in the 90th percentile?arrow_forward
- Helparrow_forwardIdentify the parameter(s). Whether or not a person consumes alcohol. The population mean amount of alcohol consumed by each person per year. all individuals who consume alcohol. The population proportion of those who consume alcohol. info: The average American consumes 100 liters of alcohol per year. Does the average college student consume less alcohol per year? A researcher surveyed 13 randomly selected college students and found that they averaged 85.7 liters of alcohol consumed per year with a standard deviation of 21 liters.arrow_forwardFind Test Statistic, P value, and Z score.arrow_forward
- QUESTION 2 What percent of scores are above an ACT score of 19?arrow_forwardResearchers measured the data speeds for a particular smartphone carrier at 50 airports. The highest speed measured was 77.8 Mbps. The complete list of 50 data speeds has a mean of x= 16.56 Mbps. And a standard deviation of s= 35.08 Mbps. What is the difference between carriers highest data speed and the mean of all 50 states. How many standard deviations is that?arrow_forward
arrow_back_ios
arrow_forward_ios
Recommended textbooks for you
- MATLAB: An Introduction with ApplicationsStatisticsISBN:9781119256830Author:Amos GilatPublisher:John Wiley & Sons Inc
 Probability and Statistics for Engineering and th...StatisticsISBN:9781305251809Author:Jay L. DevorePublisher:Cengage Learning
 Statistics for The Behavioral Sciences (MindTap C...StatisticsISBN:9781305504912Author:Frederick J Gravetter, Larry B. WallnauPublisher:Cengage Learning
  Elementary Statistics: Picturing the World (7th E...StatisticsISBN:9780134683416Author:Ron Larson, Betsy FarberPublisher:PEARSON
 The Basic Practice of StatisticsStatisticsISBN:9781319042578Author:David S. Moore, William I. Notz, Michael A. FlignerPublisher:W. H. Freeman
 Introduction to the Practice of StatisticsStatisticsISBN:9781319013387Author:David S. Moore, George P. McCabe, Bruce A. CraigPublisher:W. H. Freeman
MATLAB: An Introduction with Applications
Statistics
ISBN:9781119256830
Author:Amos Gilat
Publisher:John Wiley & Sons Inc
Probability and Statistics for Engineering and th...
Statistics
ISBN:9781305251809
Author:Jay L. Devore
Publisher:Cengage Learning
Statistics for The Behavioral Sciences (MindTap C...
Statistics
ISBN:9781305504912
Author:Frederick J Gravetter, Larry B. Wallnau
Publisher:Cengage Learning
Elementary Statistics: Picturing the World (7th E...
Statistics
ISBN:9780134683416
Author:Ron Larson, Betsy Farber
Publisher:PEARSON
The Basic Practice of Statistics
Statistics
ISBN:9781319042578
Author:David S. Moore, William I. Notz, Michael A. Fligner
Publisher:W. H. Freeman
Introduction to the Practice of Statistics
Statistics
ISBN:9781319013387
Author:David S. Moore, George P. McCabe, Bruce A. Craig
Publisher:W. H. Freeman