
MATLAB: An Introduction with Applications
6th Edition
ISBN: 9781119256830
Author: Amos Gilat
Publisher: John Wiley & Sons Inc
expand_more
expand_more
format_list_bulleted
Related questions
Concept explainers
Question
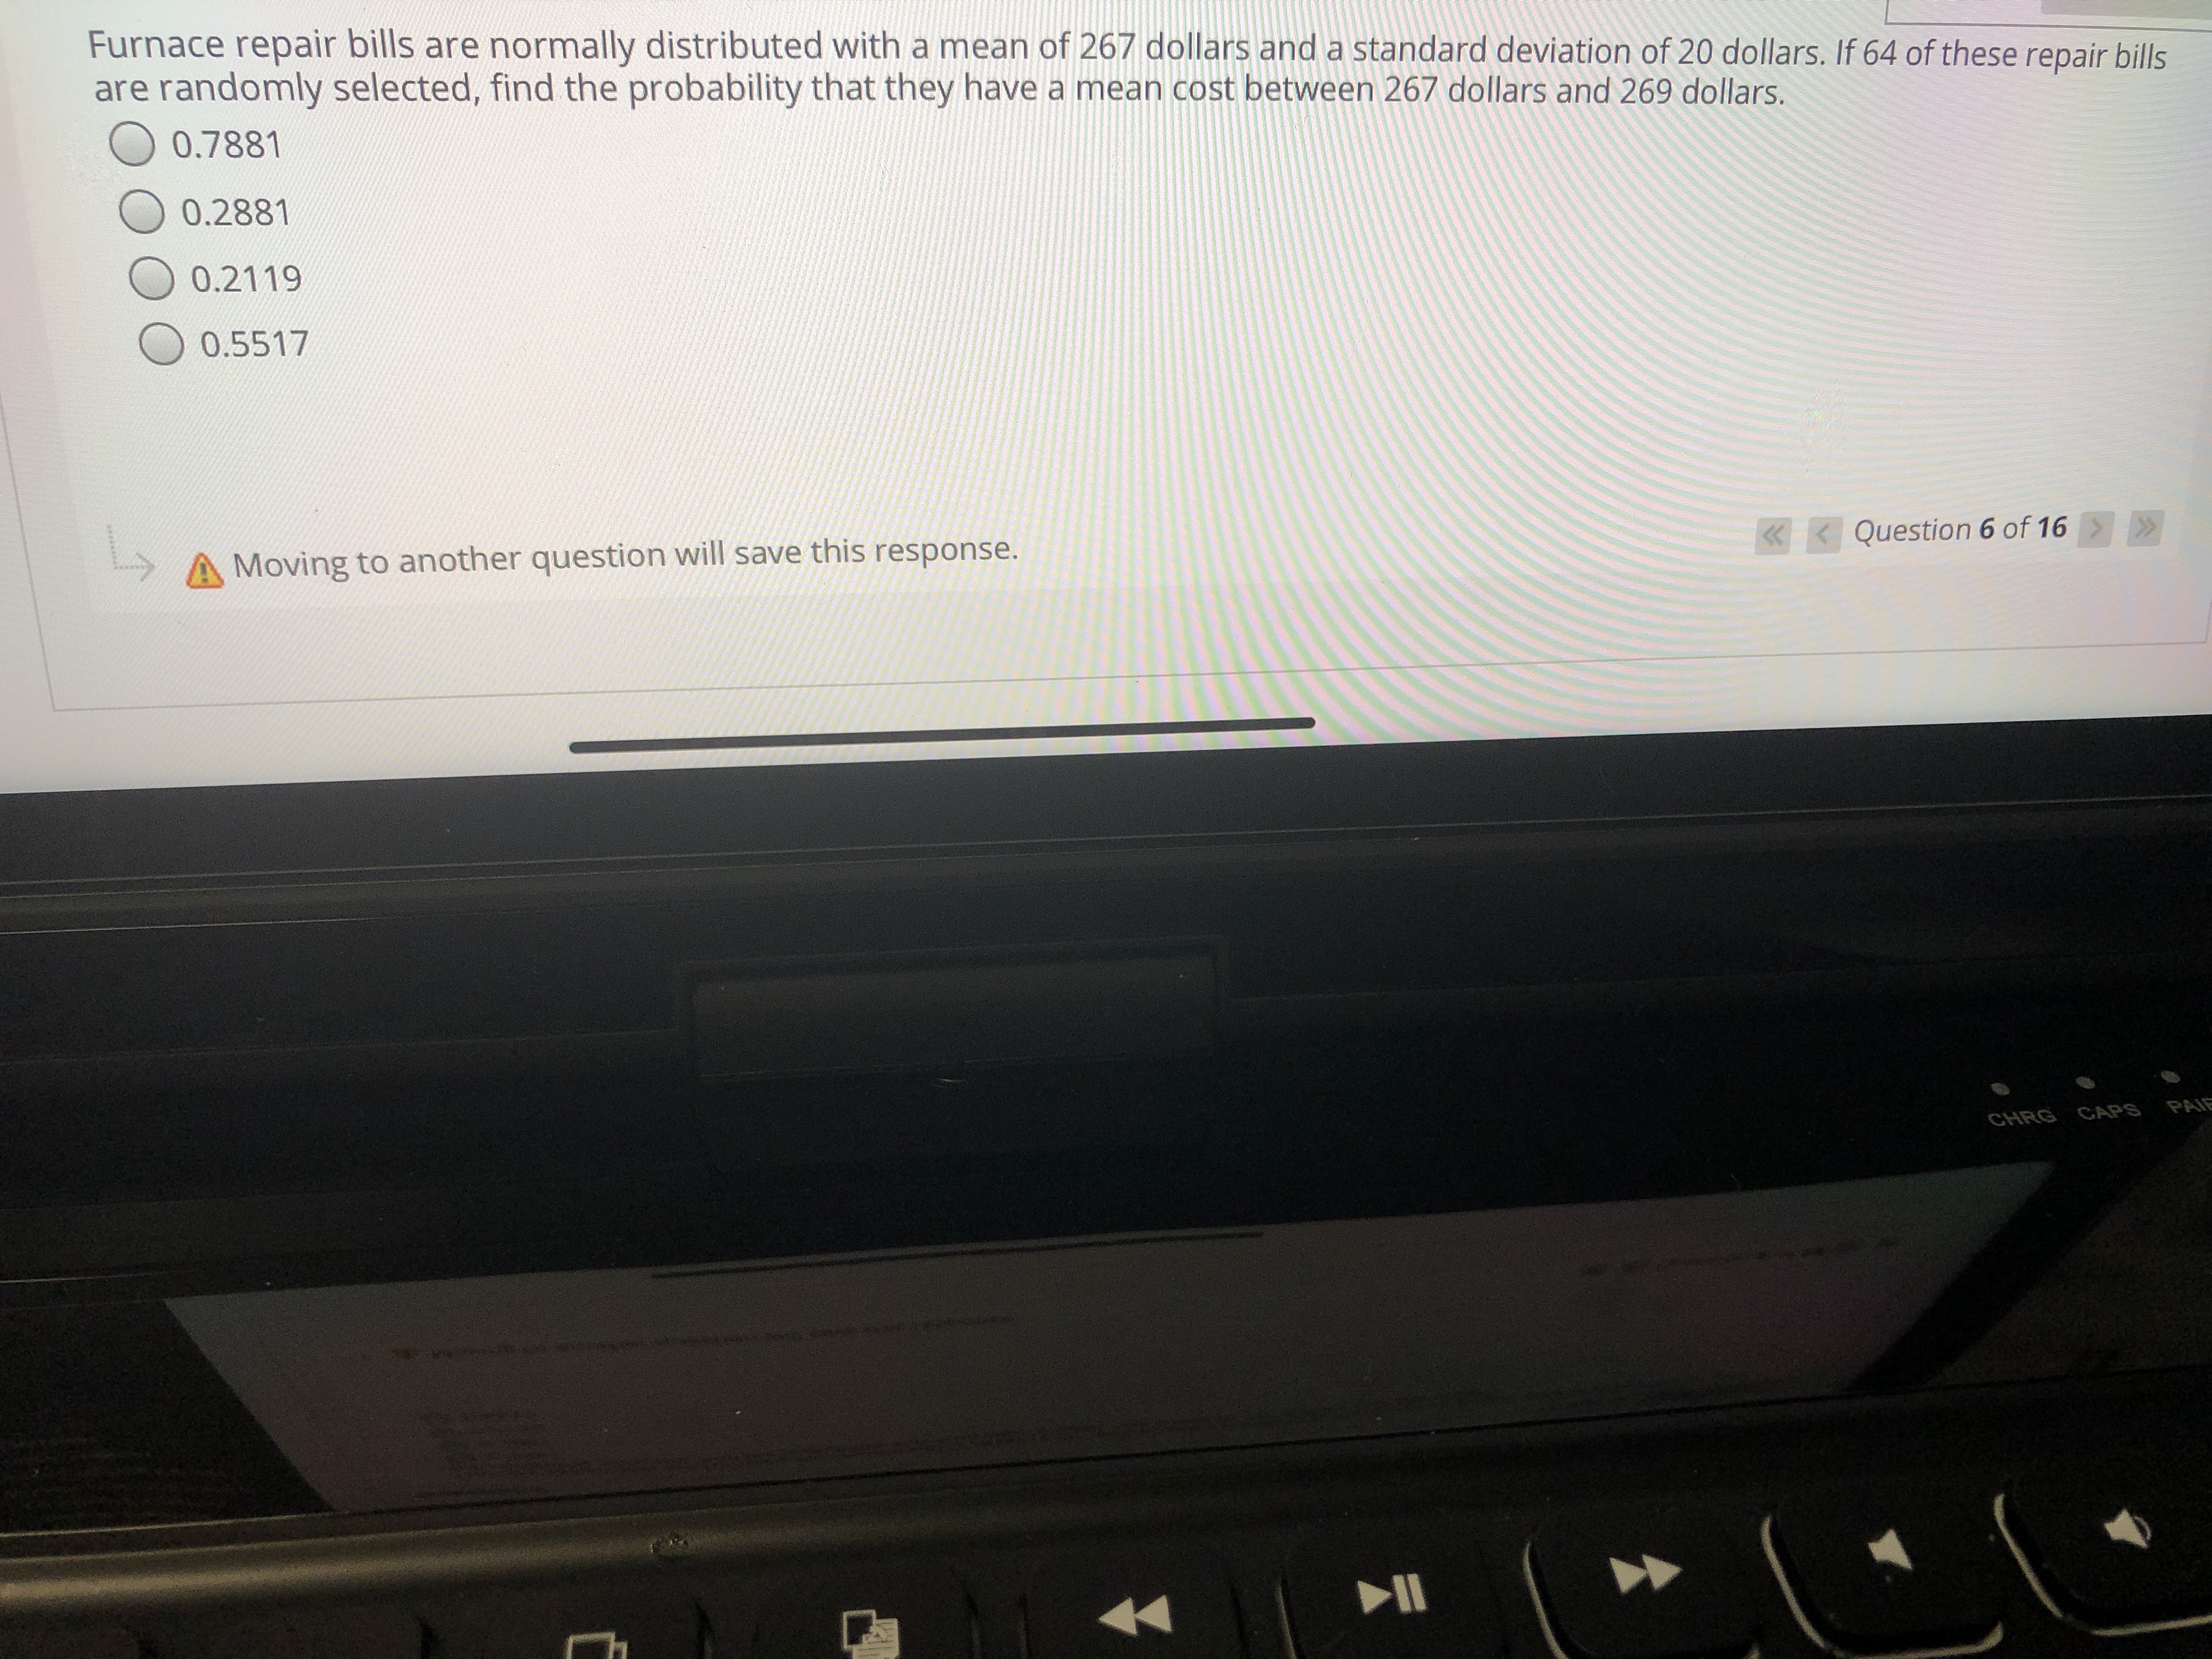

Transcribed Image Text:Furnace repair bills are normally distributed with a mean of 267 dollars and a standard deviation of 20 dollars. If 64 of these repair bills
are randomly selected, find the probability that they have a mean cost between 267 dollars and 269 dollars.
0.7881
0.2881
0.2119
0.5517
«< Question 6 of 16
Moving to another question will save this response.
Expert Solution
This question has been solved!
Explore an expertly crafted, step-by-step solution for a thorough understanding of key concepts.

This is a popular solution

Trending nowThis is a popular solution!

Step by stepSolved in 2 steps

Knowledge Booster


Learn more about
Need a deep-dive on the concept behind this application? Look no further. Learn more about this topic, statistics and related others by exploring similar questions and additional content below.Similar questions
- In the country of United States of Heightlandia, the height measurements of ten-year-old children are approximately normally distributed with a mean of 53.5 inches, and standard deviation of 4.9 inches.What is the probability that the height of a randomly chosen child is between 58.65 and 59.85 inches? Do not round until you get your your final answer, and then round to 3 decimal places.arrow_forwardIn the country of United States of Heightlandia, the height measurements of ten-year-old children are approximately normally distributed with a mean of 55.5 inches, and standard deviation of 7.5 inches.What is the probability that the height of a randomly chosen child is between 51.55 and 71.35 inches? Do not round until you get your your final answer, and then round to 3 decimal places.Answer= (Round your answer to 3 decimal places.)arrow_forwardIn the country of United States of Heightlandia, the height measurements of ten-year-old children are approximately normally distributed with a mean of 53 inches, and standard deviation of 3.4 inches.What is the probability that the height of a randomly chosen child is between 46.6 and 53.7 inches? Do not round until you get your your final answer, and then round to 3 decimal places.arrow_forward
- In the country of United States of Heightlandia, the height measurements of ten-year-old children are approximately normally distributed with a mean of 56.1 inches, and standard deviation of 1.8 inches.What is the probability that the height of a randomly chosen child is between 59.1 and 60.3 inches? Do not round until you get your your final answer, and then round to 3 decimal places.Answer= (Round your answer to 3 decimal places.)arrow_forwardplease, draw the probability distribution chart(s) and solve the questions.arrow_forwardIn the country of United States of Heightlandia, the height measurements of ten-year-old children are approximately normally distributed with a mean of 56.2 inches, and standard deviation of 8.3 inches.What is the probability that the height of a randomly chosen child is between 65.95 and 75.15 inches? Do not round until you get your your final answer, and then round to 3 decimal places.Answer= (Round your answer to 3 decimal places.)arrow_forward
- In the country of United States of Heightlandia, the height measurements of ten-year-old children are approximately normally distributed with a mean of 53.1 inches, and standard deviation of 1.1 inches. What is the probability that the height of a randomly chosen child is between 52.95 and 54.85 inches? Do not round until you get your your final answer, and then round to 3 decimal places. Answer= (Round your answer to 3 decimal places.)arrow_forwardMSNBC recently reported that the mean annual cost of auto insurance is 966 dollars. Assume the standard deviation is 275 dollars. You take a simple random sample of 94 auto insurance policies. Find the probability that a single randomly selected value exceeds 962 dollars. = Incorrect0.5058 Find the probability that a sample of size is randomly selected with a mean that exceeds 962 dollars. = Correct Enter your answers as numbers accurate to 4 decimal places.arrow_forwardIn the country of United States of Heightlandia, the height measurements of ten-year-old children are approximately normally distributed with a mean of 56.6 inches, and standard deviation of 6.6 inches. What is the probability that the height of a randomly chosen child is between 58.7 and 64.1 inches? Do not round until you get your your final answer, and then round to 3 decimal places.arrow_forward
- In the country of United States of Heightlandia, the height measurements of ten-year-old children are approximately normally distributed with a mean of 55.6 inches, and standard deviation of 8.6 inches.What is the probability that the height of a randomly chosen child is between 53.3 and 63.3 inches? Do not round until you get your your final answer, and then round to 3 decimal places.arrow_forwardIn the country of United States of Heightlandia, the height measurements of ten-year-old children are approximately normally distributed with a mean of 56.2 inches, and standard deviation of 3.5 inches, What is the probability that the height of a randomly chosen child is between 53.05 and 58.65 inches? Do not round until you get your your final answer, and then round to 3 decimal places. Answer= (Round your answer to 3 decimal places.)arrow_forwardA manufacturer knows that their items have a normally distributed length, with a mean of 10.3 inches, and standard deviation of 0.5 inches. If one item is chosen at random, what is the probability that it is less than 9.9 inches long? > Next Questionarrow_forward
arrow_back_ios
SEE MORE QUESTIONS
arrow_forward_ios
Recommended textbooks for you
- MATLAB: An Introduction with ApplicationsStatisticsISBN:9781119256830Author:Amos GilatPublisher:John Wiley & Sons Inc
 Probability and Statistics for Engineering and th...StatisticsISBN:9781305251809Author:Jay L. DevorePublisher:Cengage Learning
 Statistics for The Behavioral Sciences (MindTap C...StatisticsISBN:9781305504912Author:Frederick J Gravetter, Larry B. WallnauPublisher:Cengage Learning
  Elementary Statistics: Picturing the World (7th E...StatisticsISBN:9780134683416Author:Ron Larson, Betsy FarberPublisher:PEARSON
 The Basic Practice of StatisticsStatisticsISBN:9781319042578Author:David S. Moore, William I. Notz, Michael A. FlignerPublisher:W. H. Freeman
 Introduction to the Practice of StatisticsStatisticsISBN:9781319013387Author:David S. Moore, George P. McCabe, Bruce A. CraigPublisher:W. H. Freeman
MATLAB: An Introduction with Applications
Statistics
ISBN:9781119256830
Author:Amos Gilat
Publisher:John Wiley & Sons Inc
Probability and Statistics for Engineering and th...
Statistics
ISBN:9781305251809
Author:Jay L. Devore
Publisher:Cengage Learning
Statistics for The Behavioral Sciences (MindTap C...
Statistics
ISBN:9781305504912
Author:Frederick J Gravetter, Larry B. Wallnau
Publisher:Cengage Learning
Elementary Statistics: Picturing the World (7th E...
Statistics
ISBN:9780134683416
Author:Ron Larson, Betsy Farber
Publisher:PEARSON
The Basic Practice of Statistics
Statistics
ISBN:9781319042578
Author:David S. Moore, William I. Notz, Michael A. Fligner
Publisher:W. H. Freeman
Introduction to the Practice of Statistics
Statistics
ISBN:9781319013387
Author:David S. Moore, George P. McCabe, Bruce A. Craig
Publisher:W. H. Freeman