MATLAB: An Introduction with Applications
6th Edition
ISBN: 9781119256830
Author: Amos Gilat
Publisher: John Wiley & Sons Inc
expand_more
expand_more
format_list_bulleted
Question
thumb_up100%
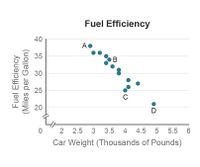
Fuel efficiency, measured in miles per gallon, is a feature often considered by shoppers looking for a new car. The
Which of the labeled points on the graph would be considered a high leverage point?
point A
point B
point C
point D

Transcribed Image Text:Fuel Efficiency
40
A
35
B
30
25
20
2 2.5 3 3.5 4 4.5 5 5.5 6
Car Weight (Thousands of Pounds)
Fuel Efficiency
(Miles per Gallon)
Expert Solution
This question has been solved!
Explore an expertly crafted, step-by-step solution for a thorough understanding of key concepts.
This is a popular solution
Trending nowThis is a popular solution!
Step by stepSolved in 2 steps

Knowledge Booster
Similar questions
- The graph shows the heights of mothers and daughters. (Source: StatCrunch: Mother and Daughter Heights.xls. Owner: craig slinkman) (a) As the data are graphed, which is the independent variable and which the dependent variable? (b) From the graph, approximate the predicted height of the daughter of a mother who is 60 inches (5feet) tall. (c) From the equation, determine the predicted height of the daughter of a mother who is 60 inches tall. (d) Interpret the slope. (e) What other factors besides the mother's height might influence the daughter’s height?arrow_forwardThe table below shows the number of state-registered automatic weapons and the murder rate for several Northwestern states. X 11.3 y 13.3 10.9 9.9 8.4 6.8 3.9 2.8 2.4 2.5 7 6.7 6.4 6.3 x = thousands of automatic weapons y = murders per 100,000 residents This data can be modeled by the equation ŷ = 0.79x + 4.32. Use this equation to answer the following. Answer = 12.829 0.9 5 A) How many murders per 100,000 residents can be expected in a state with 10.1 thousand automatic weapons? Answer = 6.123 x Round to 3 decimal places. B) How many murders per 100,000 residents can be expected in a state with 2.7 thousand automatic weapons? x Round to 3 decimal places.arrow_forward2. The number of public branch libraries in the United States for several years is given in the table: Year Public Library Branches G500 1994 6223 1995 6172 1996 Branches 6205 1997 6332 1998 6435 a. Graph the data b. Find an equation for a model of these data. Year b. Using your model, estimate the number of branch libraries in 2000 c. Use the graph to estimate in what year(s) there are 6500 branch Librariesarrow_forward
- A real estate agent has developed a linear model for the price of a house, P, in dollars in terms of the area, A, in square feet for the homes in a certain neighborhood. The data set had areas ranging from 1,000 square feet to 4,500 square feet. Would predicting the prices of a home that is 4,900 square feet be interpolation or extrapolation? Explain. Using the model to predict the price of a 4,900 square foot home is extrapolation because 4,900 square feet is outside the range of the areas in the data. Using the model to predict the price of a 4,900 square foot home is interpolation because 4,900 square feet is inside the range of the areas in the data. Using the model to predict the price of a 4,900 square foot home is extrapolation because 4,900 square feet is inside the range of the areas in the data. Using the model to predict the price of a 4,900 square foot home is interpolation because 4,900 square feet is outside the range of the areas in the data.arrow_forwardThe table below shows the number of state-registered automatic weapons and the murder rate for several Northwestern states. 11.5 8.4 6.8 3.4 2.5 2.6 2.6 0.9 13.5 10.9 9.8 6.7 6.3 6.4 4.5 x = thousands of automatic weapons y = murders per 100,000 residents This data can be modeled by the equation 0.83x + 3.99. Use this equation to answer the following; Special Note: I suggest you verify this equation by performing linear regression on your calculator. A) How many murders per 100,000 residents can be expected in a state with 8.4 thousand automatic weapons? Answer Round to 3 decimal places. B) How many murders per 100,000 residents can be expected in a state with 7.3 thousand automatic weapons? Answer Round to 3 decimal places.arrow_forwardAnswer part A and D only!arrow_forward
arrow_back_ios
arrow_forward_ios
Recommended textbooks for you
 MATLAB: An Introduction with ApplicationsStatisticsISBN:9781119256830Author:Amos GilatPublisher:John Wiley & Sons Inc
 Probability and Statistics for Engineering and th...StatisticsISBN:9781305251809Author:Jay L. DevorePublisher:Cengage Learning
 Statistics for The Behavioral Sciences (MindTap C...StatisticsISBN:9781305504912Author:Frederick J Gravetter, Larry B. WallnauPublisher:Cengage Learning
 Elementary Statistics: Picturing the World (7th E...StatisticsISBN:9780134683416Author:Ron Larson, Betsy FarberPublisher:PEARSON
 The Basic Practice of StatisticsStatisticsISBN:9781319042578Author:David S. Moore, William I. Notz, Michael A. FlignerPublisher:W. H. Freeman
 Introduction to the Practice of StatisticsStatisticsISBN:9781319013387Author:David S. Moore, George P. McCabe, Bruce A. CraigPublisher:W. H. Freeman

MATLAB: An Introduction with Applications
Statistics
ISBN:9781119256830
Author:Amos Gilat
Publisher:John Wiley & Sons Inc

Probability and Statistics for Engineering and th...
Statistics
ISBN:9781305251809
Author:Jay L. Devore
Publisher:Cengage Learning

Statistics for The Behavioral Sciences (MindTap C...
Statistics
ISBN:9781305504912
Author:Frederick J Gravetter, Larry B. Wallnau
Publisher:Cengage Learning

Elementary Statistics: Picturing the World (7th E...
Statistics
ISBN:9780134683416
Author:Ron Larson, Betsy Farber
Publisher:PEARSON

The Basic Practice of Statistics
Statistics
ISBN:9781319042578
Author:David S. Moore, William I. Notz, Michael A. Fligner
Publisher:W. H. Freeman

Introduction to the Practice of Statistics
Statistics
ISBN:9781319013387
Author:David S. Moore, George P. McCabe, Bruce A. Craig
Publisher:W. H. Freeman