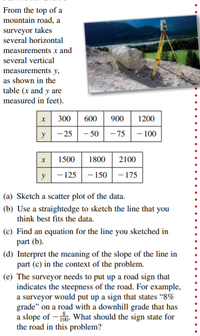
From the top of a
mountain road, a
surveyor takes
several horizontal
measurements x and
several vertical
measurements y,
as shown in the
table (x and y are
measured in feet).
x 300 600 900 1200
y −25 −50 −75 −100
x 1500 1800 2100
y −125 −150 −175
(a) Sketch a
(b) Use a straightedge to sketch the line that you
think best fits the data.
(c) Find an equation for the line you sketched in
part (b).
(d) Interpret the meaning of the slope of the line in
part (c) in the context of the problem.
(e) The surveyor needs to put up a road sign that
indicates the steepness of the road. For example,
a surveyor would put up a sign that states “8%
grade” on a road with a downhill grade that has
a slope of − 8
100. What should the sign state for
the road in this problem?

Trending nowThis is a popular solution!
Step by stepSolved in 4 steps with 2 images

- 1. Find the equation of the line tangent to the curve y = Vx at the point (4,2). Hint: Write vx = x1/2 and apply the power rule. Include a screenshot or sketch of the graph of the curve and the tangent line together on the same graph. Desmos.com is a nice, free graphing tool. %3Darrow_forwardThe “tropical zone” of the Earth is located approximately between the parallels 30º N and 30º S. What percentage of the Earth's surface is located in the tropical zone?arrow_forwardThe volume V of an ice cream cone is given by V = where R is the common radius of the spherical cap and the cone, and h is the height of the cone. Use linearization to estimate the change in the volume when R changes from R = 1.5 inches to R = 1.7 inches, and h changes from h = 4 inches to h = 4.1 inches. Give your answer to two decimal places. R ----- h 6.20 |× in3arrow_forward
- AABC is reflected over x = - 1 and then dilated by a scale factor of 2. What are the coordinates of A', the image of A? C. B Aarrow_forwardWrite the equation of the line normal to g(x) at the point where x 2. Edit View insert Format Toois Tabie T A º 511 Ev 4arrow_forward1 For the following data a) Compute the linear spline equation for each segment and simplify to get the slope-intercept form. Include the domain. b) Interpolate at x = -3.2, -0.8, 1.7 and 2.3. X y 4 -2 3 -10 O 8 - 25 2 52 3 36arrow_forward
 Trigonometry (11th Edition)TrigonometryISBN:9780134217437Author:Margaret L. Lial, John Hornsby, David I. Schneider, Callie DanielsPublisher:PEARSON
 Trigonometry (MindTap Course List)TrigonometryISBN:9781305652224Author:Charles P. McKeague, Mark D. TurnerPublisher:Cengage Learning
 Trigonometry (MindTap Course List)TrigonometryISBN:9781337278461Author:Ron LarsonPublisher:Cengage Learning


