MATLAB: An Introduction with Applications
6th Edition
ISBN: 9781119256830
Author: Amos Gilat
Publisher: John Wiley & Sons Inc
expand_more
expand_more
format_list_bulleted
Question

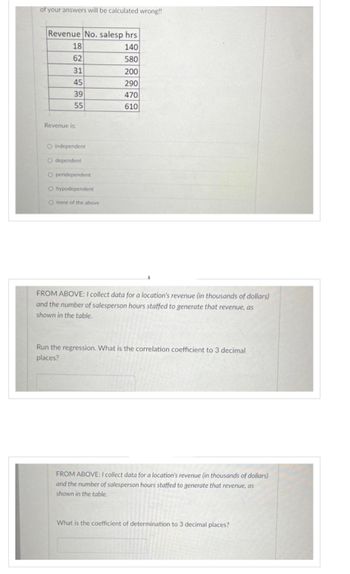
Transcribed Image Text:of your answers will be calculated wrong!!
Revenue No. salesp hrs
140
580
200
290
470
610
822
18
62
31
45
39
55
Revenue is:
O independent
O dependent
O peridependent
O hypodependent
O none of the above
FROM ABOVE: I collect data for a location's revenue (in thousands of dollars)
and the number of salesperson hours staffed to generate that revenue, as
shown in the table.
Run the regression. What is the correlation coefficient to 3 decimal
places?
FROM ABOVE: I collect data for a location's revenue (in thousands of dollars)
and the number of salesperson hours staffed to generate that revenue, as
shown in the table.
What is the coefficient of determination to 3 decimal places?

Transcribed Image Text:S
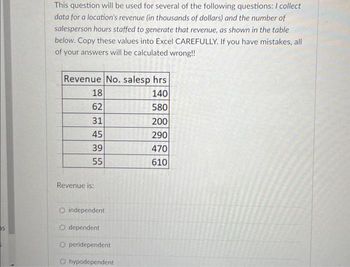
This question will be used for several of the following questions: I collect
data for a location's revenue (in thousands of dollars) and the number of
salesperson hours staffed to generate that revenue, as shown in the table
below. Copy these values into Excel CAREFULLY. If you have mistakes, all
of your answers will be calculated wrong!!
Revenue No. salesp hrs
140
580
18
62
31
45
39
55
Revenue is:
O independent
O dependent
O peridependent
O hypodependent
200
290
470
610
Expert Solution
This question has been solved!
Explore an expertly crafted, step-by-step solution for a thorough understanding of key concepts.
Step by stepSolved in 3 steps with 4 images

Knowledge Booster
Similar questions
- The mall has a set of data with employee age (X) and the corresponding number of annual on-the-job-accidents(Y). Analysis on the set finds that the regression equation is Y=100-3X. What is the likely number of accidents for someone aged 30? 97 100 10 none of the abovearrow_forwardThe number of Master’s degrees granted at a particular university is given for selected years in the table below. Year 2005 2010 2015 2020 Number of Master’s Degrees 58 69 76 83 Use the linear regression equation for this data to predict the number of Master’s degrees that this university will grant in the year 2021. Blank 1. Calculate the answer by read surrounding text. Round to the nearest whole number of Master's degrees.arrow_forwardDevelop a scatterplot and explore the correlation between customer age and net sales by each type of customer (regular/promotion). Use the horizontal axis for the customer age to graph. Find the linear regression line that models the data by each type of customer. Round the rate of changes (slopes) to two decimal places and interpret them in terms of the relation between the change in age and the change in net sales. What can you conclude? Hint: Rate of Change = Vertical Change / Horizontal Change = Change in y / Change in xarrow_forward
- I need in one hour pls help thankyouarrow_forwardBelow is the actual data on the speed a person walks or runs in miles/hour and the calories the person burns per lap. Find the linear equation of best fit for this data. Compare the model to the data. Does the model seem to fit the data? Explain. What is the significance of the y-intercept? What is the slope and what does it mean? What is the x-intercept and what does it mean? What is the correlation coefficient and what does it mean? Speed (mph) Calories/lap 1 42 2 31 3 27 4 41 5 40 6 40 7 39 8 38 r answers to the nearest hundredth. The y-intercept means that if a person runs at ----------mph they will burn__________ per lap. The slope means that for each mph you increase your speed, you will burn an additional------------calories pay laparrow_forwardA pediatrician wants to determine the relation that exists between a child's height (x) and head circumference (y). She randomly selects 11 children from her practice and measures their height and head circumference in inches. She finds that the correlation is 0.694, and the regression equation is y = 0.294x + 2.02. What proportion of the variation in head circumference can be explained by the variation in the values of height? Round your answer to three decimal places. %arrow_forward
- The accompanying table shows results from regressions performed on data from a random sample of 21 cars. The response (y) variable is CITY (fuel consumption in mi/gal). The predictor (x) variables are WT (weight in pounds), DISP (engine displacement in liters), and HWY (highway fuel consumption in mi/gal). Which regression equation is best for predicting city fuel consumption? Why? E Click the icon to view the table of regression equations. Choose the correct answer below. O A. The equation CITY = 6.65 - 0.00161WT + 0.675HWY is best because it has a low P-value and the highest adjusted value of R2. O B. The equation CITY = 6.83 - 0.00132WT - 0.253DISP + 0.654HWY is best because it has a low P-value and the highest value of R?. OC. The equation CITY = 6.83 - 0.00132WT - 0.253DISP + 0.654HWY is best because it uses all of the available predictor variables. O D. The equation CITY = - 3.14 + 0.823HWY is best because it has a low P-value and its R2 and adjusted R? values are comparable to…arrow_forwardFor 39 nations, a correlation of 0.887 was found between y = Internet use (%) and x = gross domestic product (GDP, in thousands of dollars per capita). The regression equation is y = -3.68 + 1.73x. Complete parts (a) through (c). a. Based on the correlation value, the slope had to be positive. Why? A. The slope and correlation are positive because gross domestic product could not be negative. B. The correlation and the slope are positive because the y-intercept is negative. C. That is a very unusual fact, because the slope and correlation usually have different signs. D. Although slope and correlation usually have different values, they always have the same sign.arrow_forward
arrow_back_ios
arrow_forward_ios
Recommended textbooks for you
 MATLAB: An Introduction with ApplicationsStatisticsISBN:9781119256830Author:Amos GilatPublisher:John Wiley & Sons Inc
 Probability and Statistics for Engineering and th...StatisticsISBN:9781305251809Author:Jay L. DevorePublisher:Cengage Learning
 Statistics for The Behavioral Sciences (MindTap C...StatisticsISBN:9781305504912Author:Frederick J Gravetter, Larry B. WallnauPublisher:Cengage Learning
 Elementary Statistics: Picturing the World (7th E...StatisticsISBN:9780134683416Author:Ron Larson, Betsy FarberPublisher:PEARSON
 The Basic Practice of StatisticsStatisticsISBN:9781319042578Author:David S. Moore, William I. Notz, Michael A. FlignerPublisher:W. H. Freeman
 Introduction to the Practice of StatisticsStatisticsISBN:9781319013387Author:David S. Moore, George P. McCabe, Bruce A. CraigPublisher:W. H. Freeman

MATLAB: An Introduction with Applications
Statistics
ISBN:9781119256830
Author:Amos Gilat
Publisher:John Wiley & Sons Inc

Probability and Statistics for Engineering and th...
Statistics
ISBN:9781305251809
Author:Jay L. Devore
Publisher:Cengage Learning

Statistics for The Behavioral Sciences (MindTap C...
Statistics
ISBN:9781305504912
Author:Frederick J Gravetter, Larry B. Wallnau
Publisher:Cengage Learning

Elementary Statistics: Picturing the World (7th E...
Statistics
ISBN:9780134683416
Author:Ron Larson, Betsy Farber
Publisher:PEARSON

The Basic Practice of Statistics
Statistics
ISBN:9781319042578
Author:David S. Moore, William I. Notz, Michael A. Fligner
Publisher:W. H. Freeman

Introduction to the Practice of Statistics
Statistics
ISBN:9781319013387
Author:David S. Moore, George P. McCabe, Bruce A. Craig
Publisher:W. H. Freeman