For the two bus power system shown below, use the Newton- Raphson power flow to determine the voltage magnitude and angle at bus two. Assume that bus one is the slack and SBase 100 MVA: Line Z = 0.1j 1.000 pu Two 1.000 pu One 200 MW O MW O MVR 100 MVR - j10 j10 Ybus X j10 -j10
Q: 1. Following figure shows the one-line diagram of a two bus system. Take bus 1 as slack bus, bus 2…
A:
Q: a) b) c) A load of 25 MW, with power factor 0.8 lagging, is supplied at a voltage level of 11 kV.…
A: load = 25 MWpower factor =0.8 lagging Vr =11 kV Line impedance =Zline = 0.5 + j 0.9
Q: (2) Calculate Zbus for the network shown at right, as follows. Show all steps of your calculations.…
A:
Q: 1.The primary conductor in the figure is one phase of a three-phase transmission line operating at…
A:
Q: Example :- Single Phase Circuił Us = 220LO Zeg =0-9+ jo-1 zone 3 2one 1 X Cine =22 Zone 2 Tz 300kVA…
A:
Q: (2 12 Zload = 300 %3D K L M N 13.2 kV ZL = 10 + j100 %3D 5 MVA 10 MVA 13.2A - 132Y kV 138Y – 694 kV…
A: Given: Base MVA (SB)=50 MVA For transformer A: SA=5 MVAVoltage rating: 13.2(delta)-132(star)…
Q: Problem:1 The following is the system data for a load flow solution. Determine the bus voltages at…
A: Load flow solution is a type of solution of a network under the steady state condition. The solution…
Q: An radial express feeder used on rural distribution and is connected to a lumped-sum (or…
A: Dear student as per our guidelines we are supposed to solve only one question in which it should be…
Q: The yearly load duration curve of a certain power station can be approximated as a straight line;…
A: “Since you have posted a question with multiple sub-parts, we will solve first three sub-parts for…
Q: An radial express feeder used on rural distribution and is connected to a lumped-sum (or…
A:
Q: Solve the following problem: A THREE-PHASE GENERATOR SUPPLIES THREE LOADS IN PARALLEL BY MEANS OF A…
A:
Q: In the system shown below, the generator is ideal (Xs = 0) and the magnitude of the load bus…
A:
Q: Q// For the two-bus power system shown in Fig.(PA) Slack bus (G1 V1= 1.0L0° pu Sg2 = 0.2 +j0.05 pu…
A: Answer -
Q: A single phase transmission line is delivering 470 kVA load at 14 kV. Its resistance is 4 Ω and…
A: A single phase transmission line Output power S=470 kVA load at 14 kV. Transmission line resistance…
Q: A three-phase, three-wire Y-Y system a balance load. The following information are given of the…
A: Given data: 3-phase, three-wire, Y-Y system with a balanced load. The impedance of each line,…
Q: Example No.1 • Figure below shows the single- line diagram of three-bus power Slack Bus V = 1.05Z0°…
A:
Q: The yearly load duration curve of a certain power station can be approximated as a straight line;…
A: Given data,Maximum load=40MWMinimum load=10MWiThe three turbine generator units, two rated at 20MW…
Q: For the system shown in figure, voltage V2 and angle 8, are calculated using Newton-Raphson method.…
A: It is given that:
Q: admittance diagram for the system and develop the 4 x 4 bus admittance matrix YBus by inspection. j1…
A:
Q: (a)Determine the voltages at bus 2 and bus 3 after first iterations using Gauss Seidel. Use flat…
A:
Q: The one-line diagram of a three-phase power system is as shown in the figure attached. Impedances…
A: The load at bus is S2=15.93 MW-j33.4 MvarFirst converting all the values in per-unit systemThe load…
Q: The three phase power and line-line ratings of the below electric power system is given below Vm…
A:
Q: The yearly load duration curve of a certain power station can be approximated as a straight line ;…
A: The solution can be achieved as follows.
Q: For the system shown below with x=0.9 pu, determine static limit and corresponding voltage magnitude…
A: The power system has to transmit power from the generation side to the load side. For this purpose,…
Q: The single line diagram of a three-phase power system is shown in Figure 1. Select a common base of…
A:
Q: Draw an impedance diagram for the electric power system shown in the figure attached, showing all…
A: We can obtain the impedance diagram by using below steps: -The base voltage VBG1 on the LV side of…
Q: Problem 4. A 220-kV, three-phase transmission line has a per phase series impedance z = 0.005 +…
A:
Q: Note It is expected from student to develop impedance matrices of three phase power system. Develop…
A: Z-bus is determined as shown below
Q: 100 Vi = 1.025/0° V3 = 1.03/1.36851° 300 1 Z13 90.51 Slack 136.93 Z12 Z23 2 V2 = 1.001243L-2.1° 400…
A:
Q: 4. A three-phase 500kV 60HZ, 700km, completely transposed line has the following positive- sequence…
A: Given 500 kv , 60 Hz , 700 km = L z=0.01+j0.3 Ω/km = 0.3∠88° Ω/k my = j3x10-6 s/km For nominal π…
Q: Draw an impedance diagram in per unit by choosing 100 kVA to be the base kVA and 2400 V as the base…
A:
Q: VII. PROBLEMS : 1. The IR drop in the line due to the reactive current is one disadvantage of low…
A: In this question we will write why low power factor load is undesirable...
Q: Figure below shows the one line diagram of a 3-o system. By selecting a common base of 100 MVA and…
A: There will be three sequence networks in the given power system- Positive-sequence network…
Q: 43. One conductor of a three-phase line is open. The current flowing to the delta connected load…
A: The solution is given below
Q: The scheduled power at the bus of a power system is the Difference of the Generation and load power…
A: A bus in a power system is defined as the vertical line at which the several components of the power…
Q: What do you understand by means of power system? A 3-q, 50 Hz transmission [ line is 120 km long. It…
A:
Q: For the simplified system shown, the generators are Example 6.1: connected at all the three buses.…
A: Bus voltage and its corresponding bus angle is determined as shown below
Q: A power station has to meet the following load demand: LOAD A 50kW Between 10 AM and 6 PM LOAD B…
A: The solution can be achieved as follows.
Q: A load flow analysis is to be performed on a four bus power system, the per unit admittance matrix…
A: Solution: (a) Non-diagonal elements, y12=-Y12=2-j6 y13=-Y13=1-j3…
Q: The bus admittance matrix for the power system shown in Figure 1 is given by 3-j9 −2+j6 -1+j3 0 Ybus…
A: Gauss-Seidel (G-S) method is one of the simplest iterate method. It is a modification of…
Q: Question 1 On figure 1 below is a single-phase ring distributor fed from point O at 400v, 50HZ.…
A: Given circuit- In this question, the value of per impedance of the distributor section BC is…
Q: 1. Identify unity power factor points on V-curves and comment why you will not get unity power…
A: An alternator/synchronous generator is a type of electrical machine that converts mechanical energy…
Q: Two three-generator are parallel at 6.6 kV and delivering 3000 kW at 0.8 pf. The impedance for…
A: To calculate the induced emf of machine A
Q: The one line diagram of a three phase power system is as shown in Figure 7 Impedances are marked in…
A:
Q: PROBLEMS : 1. The IR drop in the line due to the reactive current is one disadvantage of low power…
A: In this question we will write why low power factor loads are undesirable....
Q: (b) For a 4-bus 3-phase, 100 kV, 50 Hz power system, the following Y-bus and corresponding Z-bus…
A:
Q: Refer to the 5-bus data given below. Sbase = 400 MVA, the base voltage is 15.0 kV for buses 1 and 3,…
A: a) Single line diagram of given power system here series parameter are in impedance and shunt…
Q: 6. A generating station has the following daily load cycle : Time (hours) 0-6 6-10 10-12 12-16 16-20…
A: "Since you have posted a question with multiple sub-parts, we will solve first three sub-parts for…
Q: KW demand I5 UUI 4. Explain the different voltage control methods [10 A 3-phase line having an…
A: Phase modifier: This is also known as the synchronous condenser that runs without mechanical load…
Q: The three phase power and line-line ratings of the below electric power system is given below: T Vm…
A: The given system is, For generator: For motor: And
please solve it with the load being 150 MW and - 50 MVar.
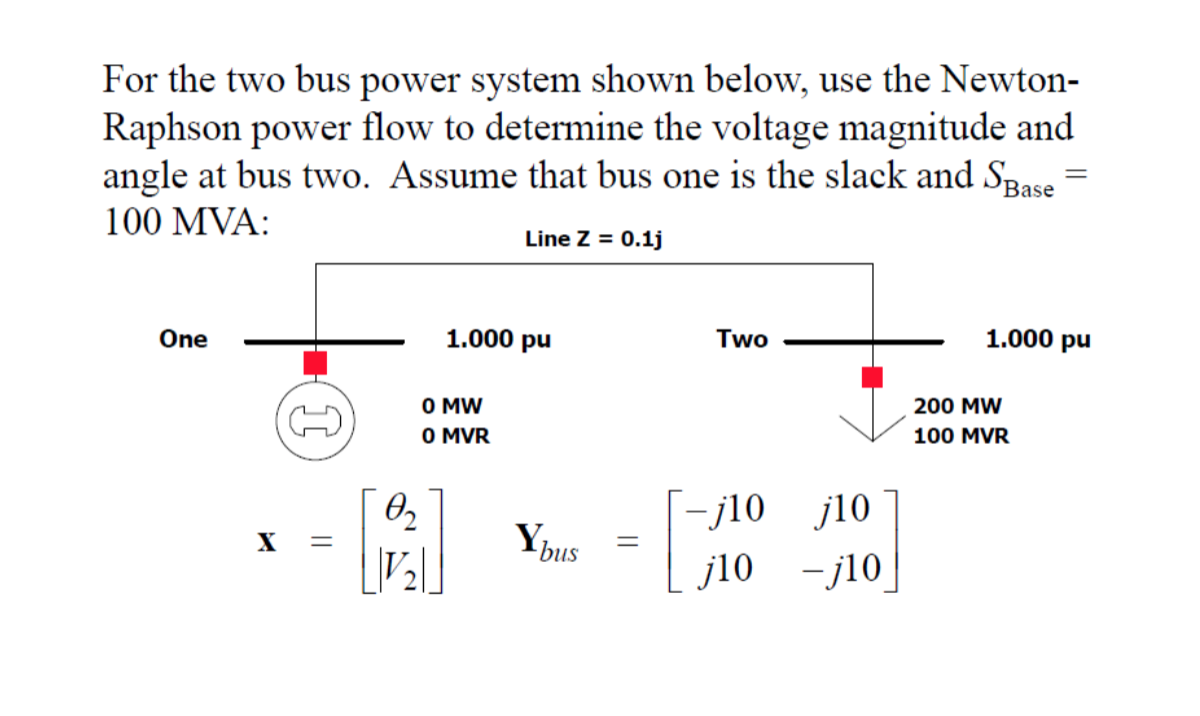
Trending now
This is a popular solution!
Step by step
Solved in 3 steps with 3 images
- The figure below shows the one-line diagram of a four- bus power system. The voltages, the scheduled real power and reactive powers, and the reactances of transmission lines are marked at this one line diagram (The voltages and reactances are in PU referred to 100 MW base. The active power P2 in MW is the last three digits (from right) of your registration number (i.e for the student that has a registration number 202112396, P2 =396). [10] Starting from an estimated voltage at bus 2, bus 3, and bus 4 equals V2 (0) = 1.15<0°, V3 = 1.15 < 0°, V4 1.1< 0°. 1- Specify the type of each bus and known & unknown quantities at each bus. 2- Find the elements of the second row of the admittance matrix (i.e. [Y21 Y22 Y23 Y24]). 3- Using Gauss-Siedal fınd the voltage at bus 2 after the first iteration. 4- Using Newton-Raphson, calculate: |- The value of real power (P2), at bus 2 after the first iteration. Il- The second element in the first row of the Jacobian matrix after the first iteration. 2 P2…The one-line diagram of a simple power system is shown in Figure below. The neutral of each generator is grounded through a current-limiting reactor of 0.25/3 per unit on a 100-MVA base. The system data expressed in per unit on a common 100-MVA base is tabulated below. The generators are running on no-load at their rated voltage and rated frequency with their emfs in phase. G Stark Item Base MVA Voltage Rating X' x² 20 kV 20 kV 20/220 kV 20/220 kV 100 0.05 0.15 0.15 0.10 0.10 220 kV 0.125 0.125 0.30 0.15 0.25 025 0.7125 0.15 100 100 0.15 0.05 0.10 0.10 0.10 100 0.10 100 100 Lu La 220 kV 0.15 220 kV 0.35 100 A balanced three-phase fault at bus 3 through a fault impedance Zf= jo.I per unit. The magnitude of the fault current in amperes in phase b for this fault is: Select one: A. 345.3 B. 820.1 C. 312500 3888888 产产Q2. Figure Q2 shows the single-line diagram. The scheduled loads at buses 2 and 3 are as marked on the diagram. Line impedances are marked in per unit on 100 MVA base and the line charging susceptances are neglected. a) Using Gauss-Seidel Method, determine the phasor values of the voltage at load bus 2 and 3 according to second iteration results. b) Find slack bus real and reactive power according to second iteration results. c) Determine line flows and line losses according to second iteration results. d) Construct a power flow according to second iteration results. Slack Bus = 1.04.20° 0.025+j0.045 0.015+j0.035 0.012+j0,03 3 |2 134.8 MW 251.9 MW 42.5 MVAR 108.6 MVAR
- For the system shown in figure, voltages V2, V3 and angles 82, 83 are calculated using Newton-Raphson method. shunt line charging admittances are neglected. All the values are given in per unit on 100MVA base. Calculate the complex power flows S12 and S32 in actual units. 1) Z12 = 0.01+ j0.02 Z3 = 0.02+ j0.04 PL G QL Slack bus V2 = 0.96L -1.67° V3 = 0.884 - 5.48° Vi=1.0/0° (estimated time to answer this question: 13 minutes)400Ω A k=0.9 600Ω B k=0.8 66Ω 600Ωplease solve for nodal stress method. (if it is possible to apply supernodes)
- What is load curveFigure below shows one-line diagram of a simple three bus power system with generation at bus 1. Bus 1 is considered as slack bus. A load consisting of 250 MW and 110 MVAR is taken from bus 2. A load consisting of 128 MW and 35 MVAR is taken from bus 3. Line impedances are marked in per unit on a 100 MVA base. Line susceptances are neglected. G1 0.01 +10.03 V₁ = 1.040° 0.02 +0.04 Select one: O a. None of these O b. 0.9245-j0.025 O c. 0.9245+j0.025 O d. -0.9245-j0.025 e. 0.9638-j0.03 0.0125+j0.025 ·0 P2 Q2 P3 Q3 Start with flat initial estimates of ₂0) = 1 + j0 & V3⁰) = 1 + j0, and keeping |V₂| = 1 pu, find V₂(¹)1. FIGURE 52 shows the one-line diagram of a simple three-bus power system with generation at bus I. The voltage at bus l is V1 = 1.0L0° per unit. The scheduled loads on buses 2 and 3 are marked on the diagram. Line impedances are marked in per unit on a 100 MVA base. For the purpose of hand calculations, line resistances and line charging susceptances are neglected a) Using Gauss-Seidel method and initial estimates of Va 0)-1.0+)0 and V o)- ( 1.0 +j0, determine V2 and V3. Perform two iterations (b) If after several iterations the bus voltages converge to V20.90-j0.10 pu 0.95-70.05 pu determine the line flows and line losses and the slack bus real and reactive power. 2 400 MW 320 Mvar Slack 0.0125 0.05 300 MW 270 Mvar FIGURE 52
- 6. For a three bus power system assume bus 1 is the swing with a per unit voltage of 1.020 , bus 2 is a PQ bus with a per unit load of 2.0 + j0:5, and bus 3 is a PV bus with 1.0 per unit generation and a 1.0 voltage setpoint. The per unit line impedances are j0.1 between buses 1 and 2, j0.4 between buses 1 and 3, and j0.2 between buses 2 and 3. Using a flat start, use the Newton-Raphson approach to determine the first iteration phasor voltages at buses 2 and 3.3) Two generating units have piecewise linear cost functions. Thus, their incremental cost functions are piecewise constant. Their piecewise constant incremental cost functions are listed below. Unit 1: 100 MW < P < 400 MW Р. (MW) dF1(P1) dP 100 - 200 7.8 200 - 400 8.1 Unit 2: 100 MW < P2 < 400 MW dF2(P2) dP2 7.5 8.2 8.3 Р. (MW) 100 - 200 200 - 300 300 - 400 Determine the generation dispatch for a system load of 450 MW.Suppose two generators supplying a load. Generator-1 has a no-load frequency of 61.5 Hz and a slopesp1 of 1 MW/Hz. Generator-2 has a no-load frequency of 62 Hz and a slope sp2 of 1MW/Hz. The twogenerators are supplying a real load totaling 2.5 MW at 0.8 PF lagging. Draw the resulting systempower-frequency or house-diagrams. Determine (a) at what frequency is the system operating, andhow much power is supplied by each of the generators? (b) if an additional 0.75-MW load wereattached to this power system. What would the new system frequency be, and how much powerwould the each generator supply now? (c) with the system in the configuration described in part (b),what will the system frequency and generators power be if the governor set points on generator-1 areincreased by 0.5 Hz?