
MATLAB: An Introduction with Applications
6th Edition
ISBN: 9781119256830
Author: Amos Gilat
Publisher: John Wiley & Sons Inc
expand_more
expand_more
format_list_bulleted
Related questions
Question
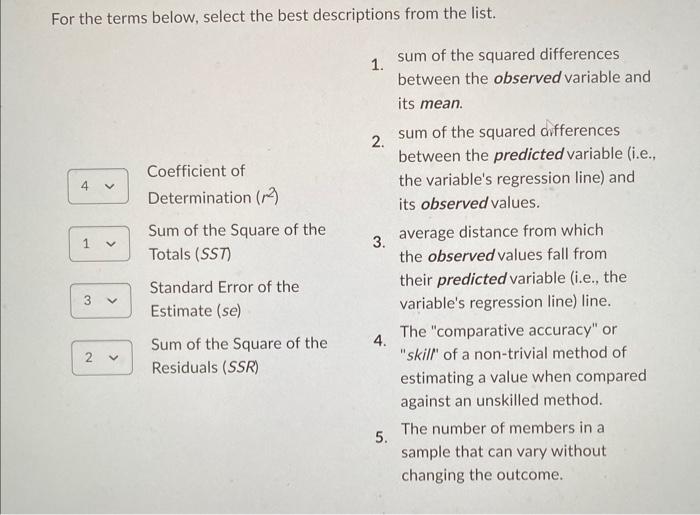

Transcribed Image Text:For the terms below, select the best descriptions from the list.
4 v
1
3
2
<
>
Coefficient of
Determination (²)
Sum of the Square of the
Totals (SST)
Standard Error of the
Estimate (se)
Sum of the Square of the
Residuals (SSR)
1. sum of the squared differences
between the observed variable and
its mean.
2.
3.
4.
5.
sum of the squared differences
between the predicted variable (i.e.,
the variable's regression line) and
its observed values.
average distance from which
the observed values fall from
their predicted variable (i.e., the
variable's regression line) line.
The "comparative accuracy" or
"skill" of a non-trivial method of
estimating a value when compared
against an unskilled method.
The number of members in a
sample that can vary without
changing the outcome.
Expert Solution
This question has been solved!
Explore an expertly crafted, step-by-step solution for a thorough understanding of key concepts.

This is a popular solution

Trending nowThis is a popular solution!

Step by stepSolved in 5 steps with 5 images

Knowledge Booster

Similar questions
- We were comparing two varibles (male and female math score)by linear regression which gives us a residual plot question 1.What is/are the purpose(s) of a residual plot in regression analysis? For the residual plot drawn in part (d), explain what you learn in the context of this problem 2.What is the purpose of drawing a histogram of the residuals in regression analysis? For the histogram of residuals drawn in part (f), explain what you learn in the context of this problem.(histogram for residuals) my answer for 1-The residual plot is to ensure or check a linear regression model is appropriate. In our case, data points are evenly placed on two sides of horizontal axis, so it is appropriate. for 2 does that tells us the data is normally distributed or not? what does the graph tells us. does the U shape means normally distributed? ( I know it is if its symmetric hill shape).arrow_forwardI do not understand how to calculate type II errorsarrow_forwardWhat is the R2 value for the relationship between Height and Weight?arrow_forward
- The standard error of the sample mean is proportional to the square root of the sample size? true or falsearrow_forwardHi, please help with this assignment. Please show the work step by step as I am having trouble understanding how to compute them.arrow_forwardThe amounts of 6 restaurant bills and the corresponding amounts of the tips are given in the below. Assume that bill amount is the explanatory variable and tip amount the response variable. Bill 32.98 49.72 52.44 64.30 97.34 88.01 Tip 4.50 5.28 7.00 7.70 16.00 10.00 (a) Find the correlation: r= (c) The regression equation is y^= . (d) If the amount of the bill is $90, the best prediction for the amount of the tip is $ .Note: Enter your answer as a number xx.xx (e) According to the regression equation, for every $5 increase in the bill, the tip should INCREASE or DECREASE) by $ .arrow_forward
arrow_back_ios
arrow_forward_ios
Recommended textbooks for you
- MATLAB: An Introduction with ApplicationsStatisticsISBN:9781119256830Author:Amos GilatPublisher:John Wiley & Sons Inc
 Probability and Statistics for Engineering and th...StatisticsISBN:9781305251809Author:Jay L. DevorePublisher:Cengage Learning
 Statistics for The Behavioral Sciences (MindTap C...StatisticsISBN:9781305504912Author:Frederick J Gravetter, Larry B. WallnauPublisher:Cengage Learning
  Elementary Statistics: Picturing the World (7th E...StatisticsISBN:9780134683416Author:Ron Larson, Betsy FarberPublisher:PEARSON
 The Basic Practice of StatisticsStatisticsISBN:9781319042578Author:David S. Moore, William I. Notz, Michael A. FlignerPublisher:W. H. Freeman
 Introduction to the Practice of StatisticsStatisticsISBN:9781319013387Author:David S. Moore, George P. McCabe, Bruce A. CraigPublisher:W. H. Freeman
MATLAB: An Introduction with Applications
Statistics
ISBN:9781119256830
Author:Amos Gilat
Publisher:John Wiley & Sons Inc
Probability and Statistics for Engineering and th...
Statistics
ISBN:9781305251809
Author:Jay L. Devore
Publisher:Cengage Learning
Statistics for The Behavioral Sciences (MindTap C...
Statistics
ISBN:9781305504912
Author:Frederick J Gravetter, Larry B. Wallnau
Publisher:Cengage Learning
Elementary Statistics: Picturing the World (7th E...
Statistics
ISBN:9780134683416
Author:Ron Larson, Betsy Farber
Publisher:PEARSON
The Basic Practice of Statistics
Statistics
ISBN:9781319042578
Author:David S. Moore, William I. Notz, Michael A. Fligner
Publisher:W. H. Freeman
Introduction to the Practice of Statistics
Statistics
ISBN:9781319013387
Author:David S. Moore, George P. McCabe, Bruce A. Craig
Publisher:W. H. Freeman