
MATLAB: An Introduction with Applications
6th Edition
ISBN: 9781119256830
Author: Amos Gilat
Publisher: John Wiley & Sons Inc
expand_more
expand_more
format_list_bulleted
Related questions
Question
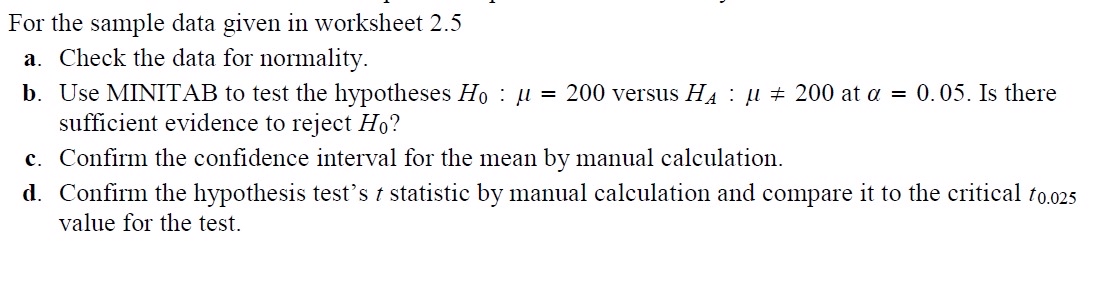

Transcribed Image Text:For the sample data given in worksheet 2.5
a. Check the data for normality.
b. Use MINITAB to test the hypotheses Hoμ = 200 versus H₁ μ 200 at α = 0.05. Is there
sufficient evidence to reject Ho?
c. Confirm the confidence interval for the mean by manual calculation.
d. Confirm the hypothesis test's t statistic by manual calculation and compare it to the critical t0.025
value for the test.

Transcribed Image Text:→>>
C1
Volts
86.4
86.5
12
3
86.5
4
83.8
5
88.3
6
87.0
7
85.3
8
83.4
9
85.8
10
85.3
11
88.9
12
85.8
13
86.8
14
83.7
15
16
56
85.2
86.8
17
86.7
18
86.6
19
84.6
20
87.8
21
84.0
22
85.1
23
84.2
24
85.2
25
87.1
26
Expert Solution
This question has been solved!
Explore an expertly crafted, step-by-step solution for a thorough understanding of key concepts.

Step by stepSolved in 2 steps

Knowledge Booster

Similar questions
- You wish to test the following claim (Ha) at a significance level of α=0.01. Ho:μ=83.8 Ha:μ<83.8You believe the population is normally distributed, but you do not know the standard deviation. You obtain a sample of size n=102 with mean M=82.5 and a standard deviation of SD=10.7.What is the test statistic for this sample? (Report answer accurate to three decimal places.) test statistic = What is the p-value for this sample? (Report answer accurate to four decimal places.) p-value = The p-value is... less than (or equal to) α greater than αarrow_forwardYou wish to test the following claim (HaHa) at a significance level of α=0.005α=0.005. Ho:μ=65.2Ho:μ=65.2 Ha:μ<65.2Ha:μ<65.2You believe the population is normally distributed, but you do not know the standard deviation. You obtain a sample of size n=101n=101 with mean M=62.6M=62.6 and a standard deviation of SD=7.9SD=7.9.What is the test statistic for this sample? (Report answer accurate to three decimal places.) test statistic = What is the p-value for this sample? (Report answer accurate to four decimal places.) p-value =arrow_forwardYou wish to test the following claim (HaHa) at a significance level of α=0.001. Ho:μ=90.9 Ha:μ>90.9You believe the population is normally distributed, but you do not know the standard deviation. You obtain a sample of size n=583 with mean M=91.7 and a standard deviation of SD=10.1.What is the test statistic for this sample? (Report answer accurate to three decimal places.)test statistic = What is the p-value for this sample? (Report answer accurate to four decimal places.)p-value = The p-value is... less than (or equal to) αα greater than αα This test statistic leads to a decision to... reject the null accept the null fail to reject the null As such, the final conclusion is that... There is sufficient evidence to warrant rejection of the claim that the population mean is greater than 90.9. There is not sufficient evidence to warrant rejection of the claim that the population mean is greater than 90.9. The sample data support the claim that the population mean is…arrow_forward
- You wish to test the following claim (HaHa) at a significance level of α=0.10. Ho:μ=61.2 Ha:μ>61.2You believe the population is normally distributed, but you do not know the standard deviation. You obtain a sample of size n=104 with mean M=64.8 and a standard deviation of SD=20.3.What is the test statistic for this sample? (Report answer accurate to three decimal places.)test statistic = __________What is the p-value for this sample? (Report answer accurate to four decimal places.)p-value = __________The p-value is... less than (or equal to) αα or greater than α (choose one) ________________arrow_forwardScores on an IQ test are normally distributed. A sample of 25 IQ scores had variance of 64. The developer of the test claims that the population standard deviation is 15. Do these data provide sufficient evidence to significance? Use α=0.05α=0.05 . Answer the following questions. (a) What is the parameter? . (input as "mean", "standard deviation", "variance" or "proportion") (b) Determine if the alternative hypothesis is "right", "left" or "two-tailed" test. (input as "right", "left" or "two-tailed") (c) Test by using a confidence interval. Round confidence interval to nearest thousandth. (e.g. 0.1345 would be entered as 0.135) between ( and ) (d) State conclusion.: There is (input as "sufficient" or "insufficient") to (input as "conclude" or "reject") to conclude that the population standard deviation of IQ test is 15.arrow_forwardAssume that adults have IQ scores that are normally distributed with a mean of μ=105 and a standard deviation σ=20. Find the probability that a randomly selected adult has an IQ less than 129. Click to view page 1 of the table. LOADING... Click to view page 2 of the table. LOADING... Question content area bottom Part 1 The probability that a randomly selected adult has an IQ less than 129 is enter your response here. (Type an integer or decimal rounded to four decimal places as needed.)arrow_forward
- ou wish to test the following claim (Ha) at a significance level of α=0.005. Ho:μ1=μ2Ha:μ1≠μ2 You believe both populations are normally distributed, but you do not know the standard deviations for either, and you have no reason to believe the variances of the two populations are equal. You obtain a sample of size n1=18 with a mean of M1=81.6 and a standard deviation of SD1=8.2 from the first population. You obtain a sample of size n2=23 with a mean of M2=88.9 and a standard deviation of SD2=5.8 from the second population. What is the p-value for this sample? (Report answer accurate to four decimal places.) p-value =arrow_forwardYou wish to test the following claim (Ha) at a significance level of α=0.001. Ho:μ=66.6 Ha:μ≠66.6You believe the population is normally distributed, but you do not know the standard deviation. You obtain a sample of size n=24 with mean M=60 and a standard deviation of SD=14.7.What is the test statistic for this sample? (Report answer accurate to three decimal places.) test statistic = What is the p-value for this sample? (Report answer accurate to four decimal places.) p-value = The p-value is which.... less than (or equal to) α greater than αarrow_forwardYou wish to test the following claim (Ha) at a significance level of α=0.005. Ho:μ=55.9 Ha:μ≠55.9You believe the population is normally distributed, but you do not know the standard deviation. You obtain a sample of size n=21 with mean M=60.1 and a standard deviation of SD=13.6.What is the p-value for this sample? (Report answer accurate to four decimal places.) p-value =arrow_forward
arrow_back_ios
arrow_forward_ios
Recommended textbooks for you
- MATLAB: An Introduction with ApplicationsStatisticsISBN:9781119256830Author:Amos GilatPublisher:John Wiley & Sons Inc
 Probability and Statistics for Engineering and th...StatisticsISBN:9781305251809Author:Jay L. DevorePublisher:Cengage Learning
 Statistics for The Behavioral Sciences (MindTap C...StatisticsISBN:9781305504912Author:Frederick J Gravetter, Larry B. WallnauPublisher:Cengage Learning
  Elementary Statistics: Picturing the World (7th E...StatisticsISBN:9780134683416Author:Ron Larson, Betsy FarberPublisher:PEARSON
 The Basic Practice of StatisticsStatisticsISBN:9781319042578Author:David S. Moore, William I. Notz, Michael A. FlignerPublisher:W. H. Freeman
 Introduction to the Practice of StatisticsStatisticsISBN:9781319013387Author:David S. Moore, George P. McCabe, Bruce A. CraigPublisher:W. H. Freeman
MATLAB: An Introduction with Applications
Statistics
ISBN:9781119256830
Author:Amos Gilat
Publisher:John Wiley & Sons Inc
Probability and Statistics for Engineering and th...
Statistics
ISBN:9781305251809
Author:Jay L. Devore
Publisher:Cengage Learning
Statistics for The Behavioral Sciences (MindTap C...
Statistics
ISBN:9781305504912
Author:Frederick J Gravetter, Larry B. Wallnau
Publisher:Cengage Learning
Elementary Statistics: Picturing the World (7th E...
Statistics
ISBN:9780134683416
Author:Ron Larson, Betsy Farber
Publisher:PEARSON
The Basic Practice of Statistics
Statistics
ISBN:9781319042578
Author:David S. Moore, William I. Notz, Michael A. Fligner
Publisher:W. H. Freeman
Introduction to the Practice of Statistics
Statistics
ISBN:9781319013387
Author:David S. Moore, George P. McCabe, Bruce A. Craig
Publisher:W. H. Freeman